Released
Farming Simulator 19
Farming Simulator 19 Stats & OverviewStore page details, rankings, sales estimates, and platform support

The best-selling franchise takes a giant leap forward with a complete overhaul of the graphics engine, offering the most striking and immersive visuals and effects, along with the deepest and most complete farming experience ever.
Platforms

Product Type
Game
Franchise
Farming Simulator
Recent Reviews
Overwhelming Positive (102)
All Reviews
Very Positive (66.98k)
User Rating
94.38%
Current Average Daily CCU
758
Wishlists
435.26k
Followers
158.87k
Top Sellers5003 (ATH:1)
Ranked 5003 on 20-11-2026.
Best: 1 on 03-12-2018, daily ranking
Best: 1 on 03-12-2018, daily ranking
Most Played-- (ATH:2)
Recently, it has not been on the daily ranking list.
Best: 2 on Invalid Date, overall ranking
Best: 2 on Invalid Date, overall ranking
Genres
Original Price
$17.99
Current Price
$17.99
Gross Revenue
$56.87m
Units Sold
1.22m
Player Modes
Controller Support
Content Rating

Achievements


Farming Simulator 19 Purchase Options & Price ComparisonBest Purchase Option: Farming Simulator 19
 United States
$14.99
 Austria
14,99€
 Australia
A$ 24.95
 Belgium
14,99€
 Brazil
R$64,95
 Canada
C$ 23.99
 Switzerland
CHF 14.90
 China
¥84.00
 Czechia
14,99€
 Germany
14,99€
 Denmark
14,99€
 Spain
14,99€
 Finland
14,99€
 France
14,99€
 United Kingdom
£12.99
 Hong Kong
HK$ 129.00
 Italy
14,99€
 Japan
¥2,250
 South Korea
₩ 22,900
 Netherlands
14,99€
 Norway
169,00 kr
 New Zealand
NZ$ 29.90
 Poland
54,99 zł
 Russia
1200 руб
 Sweden
14,99€
 Singapore
S$19.90
 Thailand
฿419.00
 Türkiye
$9.79
 Taiwan
NT$ 529.00
| Country | Original | Final | Discount | Ends in |
|---|---|---|---|---|
| United States | $14.99 | - | - | - |
| Austria | 14,99€ | - | - | - |
| Australia | A$ 24.95 | - | - | - |
| Belgium | 14,99€ | - | - | - |
| Brazil | R$64,95 | - | - | - |
| Canada | C$ 23.99 | - | - | - |
| Switzerland | CHF 14.90 | - | - | - |
| China | ¥84.00 | - | - | - |
| Czechia | 14,99€ | - | - | - |
| Germany | 14,99€ | - | - | - |
| Denmark | 14,99€ | - | - | - |
| Spain | 14,99€ | - | - | - |
| Finland | 14,99€ | - | - | - |
| France | 14,99€ | - | - | - |
| United Kingdom | £12.99 | - | - | - |
| Hong Kong | HK$ 129.00 | - | - | - |
| Italy | 14,99€ | - | - | - |
| Japan | ¥2,250 | - | - | - |
| South Korea | ₩ 22,900 | - | - | - |
| Netherlands | 14,99€ | - | - | - |
| Norway | 169,00 kr | - | - | - |
| New Zealand | NZ$ 29.90 | - | - | - |
| Poland | 54,99 zł | - | - | - |
| Russia | 1200 руб | - | - | - |
| Sweden | 14,99€ | - | - | - |
| Singapore | S$19.90 | - | - | - |
| Thailand | ฿419.00 | - | - | - |
| Türkiye | $9.79 | - | - | - |
| Taiwan | NT$ 529.00 | - | - | - |
Farming Simulator 19 Revenue & Sales EstimatesRegional sales, revenue, reviews and player trends over time
Period
Regional Analysis
Unlock game performance data including regional sales, revenue trends and player metrics over time.Upgrade to Starter →
Sales and Ratings
Unlock game performance data including regional sales, revenue trends and player metrics over time.Upgrade to Starter →
Regional Trends
Revenue & Units require Starter plan. Upgrade to Starter →Unit
Tiled Charts
Metrics
Review Count▼
Loading Regional Trends...
Regional Game Metrics
Revenue & Units require Starter plan. Upgrade to Starter →Total: 0
Farming Simulator 19 DLC Revenue & SalesSales, pricing, review and player metrics for each DLC
Unlock DLC performance data including sales, pricing, review distribution and player metrics for each DLC.
Upgrade to Pro →Farming Simulator 19 Videos & TrailersVideo coverage and creator analysis from YouTube
📹 854 videos👤 237 creators👁 703.5M views
 12:58
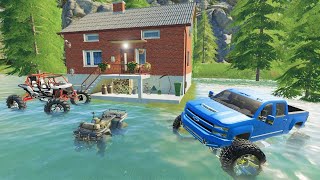
Huge storm floods our house | Camping and mudding | Farming Simulator 19
▶ 48.3M👍 83.2K💬 913
Hudson's Playground Gaming(2.4M subs)
Mar 16, 2021
 10:48
Millionaire spending a day on his private lake | Farming Simulator 19 camping and mudding
▶ 22.3M👍 100.2K💬 575
Hudson's Playground Gaming(2.4M subs)
Aug 26, 2021
 11:55
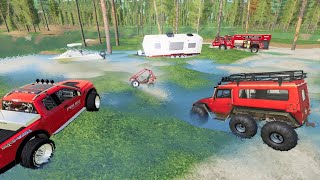
Rescuing campers after huge flood | Farming Simulator 19 camping and mudding
▶ 21.3M👍 54.9K💬 328
Hudson's Playground Gaming(2.4M subs)
Apr 15, 2021
 11:43
Camper attacked by bears at lake | Farming Simulator 19 camping and mudding
▶ 17.8M👍 33.9K💬 208
Hudson's Playground Gaming(2.4M subs)
Oct 17, 2021
 14:16
Rescuing campers after huge snow storm | Farming Simulator 19 camping and mudding
▶ 16.3M👍 72.1K💬 0
Hudson's Playground Gaming(2.4M subs)
Sep 30, 2021
 14:29
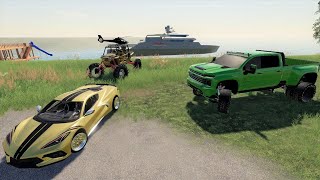
Millionaire plays with expensive cars on private beach | Farming Simulator 19
▶ 15.1M👍 32.1K💬 0
Hudson's Playground Gaming(2.4M subs)
Oct 31, 2021
 11:06
Millionaire spends a day on his private island | Farming Simulator 19 camping and mudding
▶ 14.5M👍 60.4K💬 172
Hudson's Playground Gaming(2.4M subs)
Sep 26, 2021
 9:48
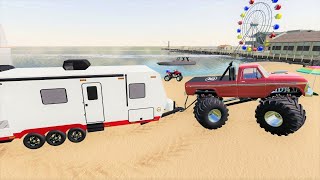
Summer beach camping with Monster truck and boats | Farming Simulator 19 camping and mudding
▶ 14.1M👍 39.9K💬 0
Hudson's Playground Gaming(2.4M subs)
Jul 4, 2021
 10:48
Camping with Millionaires on a private lake | Farming Simulator 19 Camping and Mudding
▶ 13.6M👍 19.3K💬 247
Hudson's Playground Gaming(2.4M subs)
Aug 5, 2021
 12:34
Camping in a abandoned swamp | Farming Simulator 19 camping and mudding
▶ 13.2M👍 15.8K💬 185
Hudson's Playground Gaming(2.4M subs)
Mar 2, 2021
 11:58
Rescuing lost campers from deadly swamp | Farming Simulator 19 camping and mudding
▶ 12.4M👍 16.5K💬 0
Hudson's Playground Gaming(2.4M subs)
Jul 29, 2021
 10:23
We STOPPED the train (kind of) | Farming simulator 19
▶ 12.3M👍 26.8K💬 0
Hudson's Playground Gaming(2.4M subs)
Oct 10, 2021
 10:03
Rescuing campers stuck in the swamp | Farming Simulator 19 camping and mudding
▶ 11.5M👍 17.6K💬 156
Hudson's Playground Gaming(2.4M subs)
May 13, 2021
 9:55
Police and swat arrest millionaire stealing race cars | Farming Simulator 19
▶ 11.0M👍 53.4K💬 378
Hudson's Playground Gaming(2.4M subs)
Oct 19, 2021
 11:10
Extreme camping on dangerous mountain | Farming Simulator 19 camping and mudding
▶ 11.0M👍 11.6K💬 0
Hudson's Playground Gaming(2.4M subs)
Aug 17, 2021
 10:34
Delivering MILLION dollar luxury cars (We Crash) | Farming Simulator 19
▶ 10.8M👍 11.8K💬 167
Hudson's Playground Gaming(2.4M subs)
Jul 11, 2021
 10:10
Lost campers trying to find help | Farming Simulator 19 camping and mudding
▶ 10.2M👍 16.4K💬 96
Hudson's Playground Gaming(2.4M subs)
Sep 12, 2021
 10:45
Using our lawn business to mow the towns tall grass | Farming Simulator 19
▶ 10.1M👍 34.4K💬 283
Hudson's Playground Gaming(2.4M subs)
Oct 3, 2021
 10:49
Millionaire goes camping with Lamborghini and mud truck | Farming Simulator 19
▶ 10.0M👍 36.3K💬 0
Hudson's Playground Gaming(2.4M subs)
Oct 5, 2021
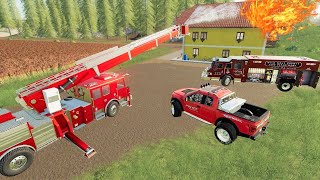 10:03
From camping to putting out HUGE fire with firetrucks | Farming Simulator 19
▶ 9.7M👍 33.1K💬 206
Hudson's Playground Gaming(2.4M subs)
May 16, 2021
Creators also play these games
 $24.99
Green Hell
Very Positive108.8K reviews
5 shared creators
 $10.99
Mist Survival
Mostly Positive15.0K reviews
4 shared creators
 $3.99
Autonauts
Very Positive5.1K reviews
4 shared creators
 $29.99
Destroy All Humans!
Very Positive12.1K reviews
9 shared creators
 $29.99
Per Aspera
Mostly Positive5.9K reviews
2 shared creators
 $24.99
112 Operator
Very Positive7.8K reviews
3 shared creators
 $17.99
Life is Strange: True Colors
Very Positive17.9K reviews
3 shared creators
 $39.99
LEGO® The Incredibles
Very Positive2.8K reviews
4 shared creators
 $19.99
Thronebreaker: The Witcher Tales
Very Positive18.0K reviews
4 shared creators
 $39.99
LEGO® DC Super-Villains
Very Positive9.0K reviews
6 shared creators
Is Farming Simulator 19 Worth It? Player Reviews AnalyzedAI-powered summary, highlights, dimensional insights and SWOT analysis
"The game is praised for its strong performance optimization that allows it to run smoothly on low-end hardware, offering highly enjoyable and immersive gameplay with intricate mechanics and exceptional replayability, while being criticized for long loading times and severe stability issues that lead to frequent crashes and connectivity problems, alongside player concerns regarding repetitive gameplay and the lack of substantial updates to maintain interest over time."
Unlock AI-powered review analysis to discover player sentiment, strengths, weaknesses, multi-dimensional insights and market positioning for this game.
Upgrade to Pro →Farming Simulator 19 Steam Rank HistoryGame ranking by indicators and genres among all Steam games
Unlock ranking data to see how this game performs across all Steam titles by key indicators and genres.
Upgrade to Starter →Games Like Farming Simulator 19Based on similar characteristics and audience overlap
Total: 107
1/22
| Name | User Rating | Review Count | Original Price | Gross Revenue | Units Sold | Franchise |
|---|---|---|---|---|---|---|
| 93% | 177 | -- | 0 | 338.87k | Farming Simulator | |
| 97% | 206.03k | $19.99 | $73.03m | 8.30m | -- | |
| 86% | 82.34k | -- | $43.28m | 8.51m | -- | |
| 90% | 12.11k | $34.99 | $18.91m | 2.16m | -- | |
| 97% | 1.00m | $4.99 | $91.69m | 18.15m | -- |


What Else Do Farming Simulator 19 Players Also Play?Based on real player follow and wishlist data
By Followers
Total: 10
1/2
| Name | Player Overlap | User Rating | Review Count | Original Price | Gross Revenue | Units Sold | Franchise |
|---|---|---|---|---|---|---|---|
| 12% | 97% | 1.00m | $4.99 | $91.69m | 18.15m | -- | |
| 10% | 88% | 2.18m | -- | $929.44m | 71.58m | Grand Theft Auto | |
| 7% | 90% | 721.72k | $9.99 | $88.80m | 23.11m | PAYDAY | |
| 11% | 97% | 206.03k | $19.99 | $73.03m | 8.30m | -- | |
| 9% | 87% | 1.05m | $59.99 | $1.92b | 54.88m | -- |


* Based on players who follow this game, showing the games they also follow most. Higher player overlap means the two games share a more similar audience.
By Wishlists
Total: 10
1/2
| Name | Player Overlap | User Rating | Review Count | Original Price | Gross Revenue | Units Sold | Franchise |
|---|---|---|---|---|---|---|---|
| 9% | 87% | 1.05m | $59.99 | $1.92b | 54.88m | -- | |
| 9% | 93% | 403.48k | $19.99 | $402.63m | 47.54m | -- | |
| 8% | 87% | 1.52m | $39.99 | $363.47m | 22.05m | -- | |
| 16% | 93% | 96.76k | $19.99 | $62.83m | 11.87m | Farming Simulator | |
| 8% | 92% | 984.30k | $59.99 | $336.90m | 28.36m | Red Dead Redemption |


* Based on players who have wishlisted this game, showing the games they also wishlist most. Higher player overlap means the two games share a more similar audience.