Released
Farming Simulator 22
Farming Simulator 22 Stats & OverviewStore page details, rankings, sales estimates, and platform support

Create your farm and let the good times grow! Harvest crops, tend to animals, manage productions, and take on seasonal challenges.
Platforms

Product Type
Game
Franchise
Farming Simulator
Recent Reviews
Overwhelming Positive (302)
All Reviews
Very Positive (72.31k)
User Rating
92.71%
Email
Current Average Daily CCU
1.97k
Wishlists
543.50k
Followers
157.23k
Top Sellers4151 (ATH:1)
Ranked 4151 on 20-11-2026.
Best: 1 on 11-09-2022, daily ranking
Best: 1 on 11-09-2022, daily ranking
Most Played-- (ATH:1)
Recently, it has not been on the daily ranking list.
Best: 1 on Invalid Date, overall ranking
Best: 1 on Invalid Date, overall ranking
Genres
Tags
Original Price
$29.99
Current Price
$19.99 (-33%)
Gross Revenue
$35.59m
Units Sold
1.63m
Player Modes
Controller Support
Content Rating

Achievements





Farming Simulator 22 Purchase Options & Price ComparisonBest Purchase Option: Farming Simulator 22
 United States
$19.99
 Austria
19,99€
 Australia
A$ 34.95
 Belgium
19,99€
 Brazil
R$94,95
 Canada
C$ 32.99
 Switzerland
CHF 19.90
 China
¥124.00
 Czechia
19,99€
 Germany
19,99€
 Denmark
19,99€
 Spain
19,99€
 Finland
19,99€
 France
19,99€
 United Kingdom
£17.45
 Hong Kong
HK$ 179.00
 Italy
19,99€
 Japan
¥3,620
 South Korea
₩ 33,900
 Netherlands
19,99€
 Norway
259,00 kr
 New Zealand
NZ$ 39.90
 Poland
72,99 zł
 Russia
1330 руб
 Sweden
19,99€
 Singapore
S$29.75
 Thailand
฿554.00
 Türkiye
$12.99
 Taiwan
NT$ 729.00
| Country | Original | Final | Discount | Ends in |
|---|---|---|---|---|
| United States | $19.99 | - | - | - |
| Austria | 19,99€ | - | - | - |
| Australia | A$ 34.95 | - | - | - |
| Belgium | 19,99€ | - | - | - |
| Brazil | R$94,95 | - | - | - |
| Canada | C$ 32.99 | - | - | - |
| Switzerland | CHF 19.90 | - | - | - |
| China | ¥124.00 | - | - | - |
| Czechia | 19,99€ | - | - | - |
| Germany | 19,99€ | - | - | - |
| Denmark | 19,99€ | - | - | - |
| Spain | 19,99€ | - | - | - |
| Finland | 19,99€ | - | - | - |
| France | 19,99€ | - | - | - |
| United Kingdom | £17.45 | - | - | - |
| Hong Kong | HK$ 179.00 | - | - | - |
| Italy | 19,99€ | - | - | - |
| Japan | ¥3,620 | - | - | - |
| South Korea | ₩ 33,900 | - | - | - |
| Netherlands | 19,99€ | - | - | - |
| Norway | 259,00 kr | - | - | - |
| New Zealand | NZ$ 39.90 | - | - | - |
| Poland | 72,99 zł | - | - | - |
| Russia | 1330 руб | - | - | - |
| Sweden | 19,99€ | - | - | - |
| Singapore | S$29.75 | - | - | - |
| Thailand | ฿554.00 | - | - | - |
| Türkiye | $12.99 | - | - | - |
| Taiwan | NT$ 729.00 | - | - | - |
Farming Simulator 22 Revenue & Sales EstimatesRegional sales, revenue, reviews and player trends over time
Period
Regional Analysis
Unlock game performance data including regional sales, revenue trends and player metrics over time.Upgrade to Starter →
Sales and Ratings
Unlock game performance data including regional sales, revenue trends and player metrics over time.Upgrade to Starter →
Regional Trends
Revenue & Units require Starter plan. Upgrade to Starter →Unit
Tiled Charts
Metrics
Review Count▼
Loading Regional Trends...
Regional Game Metrics
Revenue & Units require Starter plan. Upgrade to Starter →Total: 0
Farming Simulator 22 DLC Revenue & SalesSales, pricing, review and player metrics for each DLC
Unlock DLC performance data including sales, pricing, review distribution and player metrics for each DLC.
Upgrade to Pro →Farming Simulator 22 Videos & TrailersVideo coverage and creator analysis from YouTube
📹 2686 videos👤 333 creators👁 1151.9M views
 11:02
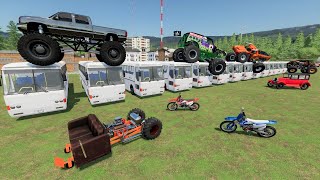
Stuntman jumps Monster Truck over lake and buses | Farming Simulator 22
▶ 22.0M👍 33.4K💬 0
Hudson's Playground Gaming(2.4M subs)
Oct 9, 2022
 10:07
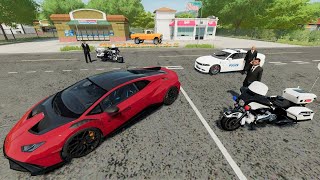
Police give tickets to EVERYONE | Farming Simulator 22
▶ 17.2M👍 32.9K💬 0
Hudson's Playground Gaming(2.4M subs)
Mar 31, 2022
 10:21
Police Chase Bad Guy with Gold Lamborghini and Army Tank | Farming Simulator 22
▶ 14.8M👍 20.1K💬 236
Hudson's Playground Gaming(2.4M subs)
Apr 11, 2024
 11:05
Our lawn mower business made us RICH | Farming Simulator 22
▶ 14.4M👍 40.5K💬 364
Hudson's Playground Gaming(2.4M subs)
Jan 20, 2022
 11:56
Finding the Fastest Racecar in Farming Sim | Farming Simulator 22
▶ 13.2M👍 18.5K💬 196
Hudson's Playground Gaming(2.4M subs)
Feb 25, 2024
 10:52
Buying abandoned barn with secret tunnel full of race cars | Farming Simulator 22
▶ 12.6M👍 59.0K💬 229
Hudson's Playground Gaming(2.4M subs)
Mar 6, 2022
 11:37
Finding abandoned barn with secret cave inside | Farming Simulator 22
▶ 12.2M👍 21.4K💬 136
Hudson's Playground Gaming(2.4M subs)
Jul 12, 2022
 12:26
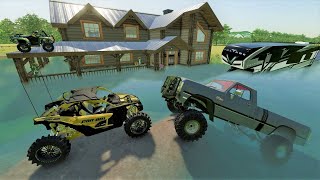
Our house and camper are flooded and destroyed | Farming Simulator 22 camping and mudding
▶ 11.6M👍 27.8K💬 137
Hudson's Playground Gaming(2.4M subs)
Dec 26, 2021
 11:48
Trading trucks to start the best lawn mower business | Farming Simulator 22
▶ 11.4M👍 24.2K💬 161
Hudson's Playground Gaming(2.4M subs)
Jan 30, 2022
 11:12
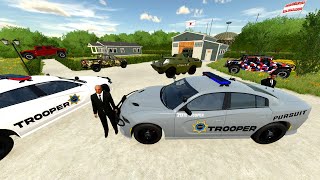
Police Find Secret Army Base | Farming Simulator 22
▶ 11.0M👍 11.9K💬 118
Hudson's Playground Gaming(2.4M subs)
Jan 28, 2024
 10:13
Racing Tractors and Race Cars against farmers | Farming Simulator 22
▶ 10.9M👍 25.2K💬 0
Hudson's Playground Gaming(2.4M subs)
May 29, 2022
 11:43
Finding Lamborghini Police Cars in Abandoned Police Station | Farming Simulator 22
▶ 10.7M👍 61.1K💬 268
Hudson's Playground Gaming(2.4M subs)
Sep 15, 2024
 9:40
Police give tickets to Monster Truck and Race car | Farming Simulator 22
▶ 10.6M👍 26.7K💬 0
Hudson's Playground Gaming(2.4M subs)
May 5, 2022
 11:46
Millionaire goes camping with Submarine and ATV | Farming Simulator 22
▶ 10.5M👍 31.7K💬 0
Hudson's Playground Gaming(2.4M subs)
Feb 13, 2022
 10:28
Finding the BEST abandoned barn at auction | Farming Simulator 22
▶ 9.8M👍 30.7K💬 207
Hudson's Playground Gaming(2.4M subs)
Jul 17, 2022
 10:14
Destruction Derby Winner Gets Rare Vehicle | Farming Simulator 22
▶ 9.7M👍 6.3K💬 72
Hudson's Playground Gaming(2.4M subs)
Jun 9, 2024
 10:33
Saving campers getting attacked by bears | Farming Simulator 22
▶ 9.5M👍 6.9K💬 0
Hudson's Playground Gaming(2.4M subs)
May 28, 2023
 24:35
TRANSPORTING POLICE CARS WITH BIG TRUCKS and TRAIN! Farming Simulator 22
▶ 9.4M👍 20.0K💬 0
Dino Farmer(500.0K subs)
Oct 18, 2023
 9:30
Racing Monster Trucks and Lamborghinis for TONS of money | Farming Simulator 22
▶ 9.2M👍 23.9K💬 0
Hudson's Playground Gaming(2.4M subs)
Mar 30, 2023
 10:47
Buying Abandoned Zoo Full of Dangerous Animals | Farming Simulator 22
▶ 9.1M👍 8.4K💬 92
Hudson's Playground Gaming(2.4M subs)
Mar 14, 2024
Creators also play these games
 $29.99
Farming Simulator 25
Very Positive63.0K reviews
36 shared creators
 $24.99
Construction Simulator
Very Positive16.1K reviews
27 shared creators
 $29.99
SnowRunner
Very Positive60.0K reviews
21 shared creators
 $39.99
RoadCraft
Mostly Positive17.2K reviews
7 shared creators
 $29.99
Surviving the Aftermath
Mostly Positive4.8K reviews
7 shared creators
 $29.99
Railroads Online
Mostly Positive6.4K reviews
2 shared creators
 $29.99
Docked
Mostly Positive1.3K reviews
4 shared creators
 $19.99
Lawn Mowing Simulator
Mostly Positive3.2K reviews
8 shared creators
 $39.99
Tropico 6
Very Positive30.4K reviews
7 shared creators
 $14.99
My Summer Car
Very Positive126.8K reviews
7 shared creators
Is Farming Simulator 22 Worth It? Player Reviews AnalyzedAI-powered summary, highlights, dimensional insights and SWOT analysis
"The player feedback highlights that the game features improved overall performance and a well-received design that enhances the gameplay experience alongside engaging farming mechanics that promote a humorous and challenging environment, while on the downside, it suffers from severe performance issues that lead to frequent crashes and significant gameplay hindrances, with user confusion stemming from unclear instructions, exacerbated by flaws in automatic routing and AI navigation leading to frustration; moreover, the graphics and physics feel outdated, diminishing visual appeal, despite some players enjoying immersive visual settings, and while the narrative and character development boost engagement, players express a desire for deeper plot twists and more detailed world-building; also, although certain steering wheels improve the gameplay experience, there are concerns about the intuitiveness of controls compared to past versions, compounded by frustrations with AI's inability to follow simple tasks, and despite the high replayability initially perceived, some players find interest waning post-main tasks, suggesting the need for additional content, as feedback reflects a mixed reception toward modded content and the introduction of horses, indicating varying levels of enjoyment across the community and multiplayer settings."
Unlock AI-powered review analysis to discover player sentiment, strengths, weaknesses, multi-dimensional insights and market positioning for this game.
Upgrade to Pro →Farming Simulator 22 Steam Rank HistoryGame ranking by indicators and genres among all Steam games
Unlock ranking data to see how this game performs across all Steam titles by key indicators and genres.
Upgrade to Starter →Games Like Farming Simulator 22Based on similar characteristics and audience overlap
Total: 99
1/20
| Name | User Rating | Review Count | Original Price | Gross Revenue | Units Sold | Franchise |
|---|---|---|---|---|---|---|
| 82% | 7.21k | $39.99 | $7.11m | 672.09k | -- | |
| 33% | 45.64k | $59.99 | $202.65m | 9.38m | NBA 2K | |
| 93% | 15 | $5.99 | $508.84k | 85.24k | Farming Simulator | |
| 92% | 15.60k | $25.99 | $4.62m | 408.55k | -- | |
| 88% | 343.32k | $29.99 | $386.28m | 20.07m | -- |


What Else Do Farming Simulator 22 Players Also Play?Based on real player follow and wishlist data
By Followers
Total: 10
1/2
| Name | Player Overlap | User Rating | Review Count | Original Price | Gross Revenue | Units Sold | Franchise |
|---|---|---|---|---|---|---|---|
| 10% | 97% | 1.00m | $4.99 | $91.69m | 18.15m | -- | |
| 16% | 94% | 79.17k | $17.99 | $36.13m | 6.65m | Farming Simulator | |
| 8% | 88% | 2.18m | -- | $929.44m | 71.58m | Grand Theft Auto | |
| 6% | 90% | 721.72k | $9.99 | $88.80m | 23.11m | PAYDAY | |
| 9% | 97% | 206.03k | $19.99 | $73.03m | 8.30m | -- |


* Based on players who follow this game, showing the games they also follow most. Higher player overlap means the two games share a more similar audience.
By Wishlists
Total: 10
1/2
| Name | Player Overlap | User Rating | Review Count | Original Price | Gross Revenue | Units Sold | Franchise |
|---|---|---|---|---|---|---|---|
| 9% | 88% | 343.32k | $29.99 | $386.28m | 20.07m | -- | |
| 11% | 89% | 299.54k | $59.99 | $768.82m | 31.84m | Forza | |
| 9% | 87% | 1.05m | $59.99 | $1.92b | 54.88m | -- | |
| 8% | 92% | 1.22m | $59.99 | $4.33b | 132.95m | -- | |
| 9% | 78% | 373.99k | $24.99 | $499.26m | 17.13m | -- |


* Based on players who have wishlisted this game, showing the games they also wishlist most. Higher player overlap means the two games share a more similar audience.