Released
The Witcher 3: Wild Hunt — Remastered
The Witcher 3: Wild Hunt — Remastered Stats & OverviewStore page details, rankings, sales estimates, and platform support

The Witcher 3: Wild Hunt — Remastered modernizes the acclaimed role-playing game with a range of upgrades and enhancements. Become monster slayer for hire Geralt of Rivia and journey across a dark fantasy open world in an epic quest to find your adopted daughter Ciri.
Platforms

Product Type
Game
Recent Reviews
Very Positive (5.04k)
All Reviews
Overwhelming Positive (879.47k)
User Rating
96.17%
Current Average Daily CCU
20.28k
Wishlists
1.97m
Followers
1.07m
Top Sellers740 (ATH:1)
Ranked 740 on 14-11-2026.
Best: 1 on 20-08-2016, daily ranking
Best: 1 on 20-08-2016, daily ranking
Most Played-- (ATH:1)
Recently, it has not been on the daily ranking list.
Best: 1 on 18-05-2015, daily ranking
Best: 1 on 18-05-2015, daily ranking
Genres
Tags
Original Price
$39.99
Current Price
$49.99
Gross Revenue
$563.58m
Units Sold
19.75m
Player Modes
Content Rating

Achievements


The Witcher 3: Wild Hunt — Remastered Purchase Options & Price ComparisonBest Purchase Option: The Witcher 3: Wild Hunt — Remastered
 United States
$49.99
 Austria
49,99€
 Australia
A$ 69.99
 Belgium
49,99€
 Brazil
R$159,99
 Canada
C$ 69.99
 Switzerland
CHF 44.99
 China
¥199.00
 Czechia
49,99€
 Germany
49,99€
 Denmark
49,99€
 Spain
49,99€
 Finland
49,99€
 France
49,99€
 United Kingdom
£39.99
 Hong Kong
HK$ 389.00
 Italy
49,99€
 Japan
¥6,490
 South Korea
₩ 54,900
 Netherlands
49,99€
 Norway
490,00 kr
 New Zealand
NZ$ 84.99
 Poland
149,99 zł
 Sweden
49,99€
 Singapore
S$59.99
 Thailand
฿1,299.00
 Türkiye
$34.99
 Taiwan
NT$ 999.00
| Country | Original | Final | Discount | Ends in |
|---|---|---|---|---|
| United States | $49.99 | - | - | - |
| Austria | 49,99€ | - | - | - |
| Australia | A$ 69.99 | - | - | - |
| Belgium | 49,99€ | - | - | - |
| Brazil | R$159,99 | - | - | - |
| Canada | C$ 69.99 | - | - | - |
| Switzerland | CHF 44.99 | - | - | - |
| China | ¥199.00 | - | - | - |
| Czechia | 49,99€ | - | - | - |
| Germany | 49,99€ | - | - | - |
| Denmark | 49,99€ | - | - | - |
| Spain | 49,99€ | - | - | - |
| Finland | 49,99€ | - | - | - |
| France | 49,99€ | - | - | - |
| United Kingdom | £39.99 | - | - | - |
| Hong Kong | HK$ 389.00 | - | - | - |
| Italy | 49,99€ | - | - | - |
| Japan | ¥6,490 | - | - | - |
| South Korea | ₩ 54,900 | - | - | - |
| Netherlands | 49,99€ | - | - | - |
| Norway | 490,00 kr | - | - | - |
| New Zealand | NZ$ 84.99 | - | - | - |
| Poland | 149,99 zł | - | - | - |
| Sweden | 49,99€ | - | - | - |
| Singapore | S$59.99 | - | - | - |
| Thailand | ฿1,299.00 | - | - | - |
| Türkiye | $34.99 | - | - | - |
| Taiwan | NT$ 999.00 | - | - | - |
The Witcher 3: Wild Hunt — Remastered Revenue & Sales EstimatesRegional sales, revenue, reviews and player trends over time
Period
Regional Analysis
Unlock game performance data including regional sales, revenue trends and player metrics over time.Upgrade to Starter →
Sales and Ratings
Unlock game performance data including regional sales, revenue trends and player metrics over time.Upgrade to Starter →
Regional Trends
Revenue & Units require Starter plan. Upgrade to Starter →Unit
Tiled Charts
Metrics
Review Count▼
Loading Regional Trends...
Regional Game Metrics
Revenue & Units require Starter plan. Upgrade to Starter →Total: 0
The Witcher 3: Wild Hunt — Remastered DLC Revenue & SalesSales, pricing, review and player metrics for each DLC
Unlock DLC performance data including sales, pricing, review distribution and player metrics for each DLC.
Upgrade to Pro →The Witcher 3: Wild Hunt — Remastered Videos & TrailersVideo coverage and creator analysis from YouTube
📹 3165 videos👤 932 creators👁 417.5M views
 2:45
The Witcher 3: Wild Hunt - Killing Monsters Cinematic Trailer
▶ 18.8M👍 293.6K💬 24.8K
The Witcher(560.0K subs)
Aug 14, 2013
 2:22
The Witcher 3: Wild Hunt OST - Sword of Destiny - Main Theme
▶ 16.4M👍 143.0K💬 4.1K
Lona90Bs(13.2K subs)
Jun 9, 2014
 5:33
The Witcher 3- Wild Hunt OST - Silver For Monsters [HQ] [Extended]
▶ 10.3M👍 84.5K💬 2.7K
Gunners Game(2.9K subs)
Jun 19, 2018
 37:02
The Witcher 3: Wild Hunt - Official Gameplay (35 min)
▶ 8.0M👍 69.9K💬 9.1K
The Witcher(560.0K subs)
Aug 19, 2014
 4:44
The Witcher 3: Wild Hunt - Launch Cinematic
▶ 7.6M👍 156.5K💬 10.0K
The Witcher(560.0K subs)
May 14, 2015
 7:37
Gaunter o' Dimm Theme | The Witcher 3: Wild Hunt | Hearts of Stone
▶ 7.3M👍 67.2K💬 6.6K
MaCross Gaming Channel(1.6K subs)
Jun 18, 2016
 21:31
LET THE HUNT BEGIN! - The Witcher 3: Wild Hunt - Walkthrough / Playthrough / Gameplay- Part 1
▶ 6.2M👍 169.4K💬 12
PewDiePie(110.0M subs)
May 19, 2015
 43:00
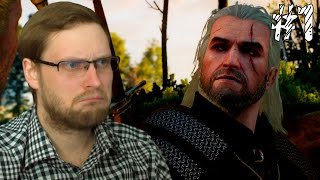
The Witcher 3: Wild Hunt Прохождение ► А ВОТ И ОН ► #1
▶ 5.3M👍 101.3K💬 3.3K
Kuplinov ► Play(17.3M subs)
May 19, 2015
 1:19:47
Прохождение Ведьмак 3: Дикая Охота (The Witcher 3: Wild Hunt) — Часть 1: Бестия из Белого сада
▶ 5.1M👍 59.1K💬 2.0K
RusGameTactics(3.8M subs)
May 18, 2015
 2:22
The Witcher 3: Wild Hunt - The Sword of Destiny E3 2014 Trailer
▶ 4.8M👍 54.3K💬 3.2K
GameSpot(5.7M subs)
Jun 5, 2014
 2:08
The Witcher 3: Wild Hunt - Debut Gameplay Trailer
▶ 4.3M👍 42.9K💬 8.6K
The Witcher(560.0K subs)
Jun 10, 2013
 3:22:06
The Witcher 3 Wild Hunt - Parte 1: Geralt de Rivia [ Playstation 4 - Playthrough PT-BR ]
▶ 4.2M👍 82.8K💬 2.4K
Lucky Salamander(2.7M subs)
May 19, 2015
 24:44
The Witcher 3 Wild Hunt Walkthrough Gameplay Part 1 - Yennefer (PS4 Xbox One)
▶ 4.2M👍 105.2K💬 14.8K
theRadBrad(14.0M subs)
May 14, 2015
 18:43
The Witcher 3: Wild Hunt - The Vagabond Music Extended
▶ 4.1M👍 32.4K💬 1.4K
MrYayoye(1.5K subs)
May 21, 2015
 3:46
Official Launch Trailer - The Witcher 3: Wild Hunt
▶ 3.8M👍 40.6K💬 2.9K
GameSpot(5.7M subs)
May 18, 2015
 3:19
Piosenka Priscilli - Wiedźmin 3 : Dziki Gon - Wilcza zamieć - Czysta wersja (+tekst)
▶ 3.8M👍 39.0K💬 1.7K
Extaco(2.6K subs)
May 26, 2015
 11:42
Ведьмак 3: Дикая Охота "Баги, Приколы, Фейлы"
▶ 3.8M👍 204.3K💬 7.0K
Marmok(19.4M subs)
Sep 16, 2016
 5:00
The Witcher 3: Wild Hunt Review
▶ 3.7M👍 31.0K💬 5.0K
IGN(19.8M subs)
May 12, 2015
 33:06:23
The Witcher 3: Wild Hunt FULL Walkthrough Gameplay - No Commentary (PC Longplay)
▶ 3.4M👍 28.9K💬 1.2K
Lacry(151.0K subs)
Apr 18, 2021
 2:22
The Witcher 3: Wild Hunt - Sword of Destiny Trailer Music
▶ 3.4M👍 31.3K💬 1.3K
Marcin Przybyłowicz(17.4K subs)
Jun 10, 2014
Creators also play these games
 $29.99
Deus Ex: Mankind Divided
Mostly Positive43.9K reviews
38 shared creators
 $29.99
Dead Rising 4
Mixed8.8K reviews
16 shared creators
 $29.99
South Park™: The Fractured But Whole™
Very Positive36.2K reviews
26 shared creators
 $5.99
Assassin’s Creed® Rogue
Very Positive23.9K reviews
37 shared creators
 $29.99
Rise of the Tomb Raider™
Very Positive164.1K reviews
52 shared creators

Wolfenstein: The Old Blood
Very Positive24.8K reviews
23 shared creators
 $19.99
Wolfenstein: The Old Blood
Very Positive24.4K reviews
23 shared creators
 $14.99
Saints Row: Gat out of Hell
Mostly Positive10.3K reviews
18 shared creators
 $29.99
Far Cry® Primal
Very Positive43.5K reviews
32 shared creators
 $39.99
The Evil Within 2
Very Positive32.4K reviews
36 shared creators
Is The Witcher 3: Wild Hunt — Remastered Worth It? Player Reviews AnalyzedAI-powered summary, highlights, dimensional insights and SWOT analysis
"The predominant player feedback highlights that the next-gen update significantly optimizes battle performance for a smoother experience, the game’s open-world story and gameplay depth are lauded as exceptional, while replayability is enhanced through various engaging events and compelling graphics; however, players face rampant stability issues with frequent crashes and save losses, experience notable performance setbacks due to CPU bottlenecking and poor character animation optimization, as well as frustration with inconsistent gameplay mechanics and a demand for more content to sustain long-term interest, indicating a mix of satisfaction and dissatisfaction concerning the overall gaming experience."
Unlock AI-powered review analysis to discover player sentiment, strengths, weaknesses, multi-dimensional insights and market positioning for this game.
Upgrade to Pro →The Witcher 3: Wild Hunt — Remastered Steam Rank HistoryGame ranking by indicators and genres among all Steam games
Unlock ranking data to see how this game performs across all Steam titles by key indicators and genres.
Upgrade to Starter →Games Like The Witcher 3: Wild Hunt — RemasteredBased on similar characteristics and audience overlap
Total: 89
1/18
| Name | User Rating | Review Count | Original Price | Gross Revenue | Units Sold | Franchise |
|---|---|---|---|---|---|---|
| 95% | 375.37k | $59.99 | $286.10m | 17.01m | -- | |
| 96% | 195.54k | $49.99 | $512.75m | 24.46m | PlayStation Studios, God of War | |
| 93% | 60.83k | $49.99 | $138.39m | 10.69m | Marvel's Spider-Man | |
| 87% | 132.99k | -- | $161.17m | 17.45m | PlayStation Studios, Horizon | |
| 89% | 197.84k | $11.99 | $45.70m | 10.54m | Assassin's Creed |


What Else Do The Witcher 3: Wild Hunt — Remastered Players Also Play?Based on real player follow and wishlist data
By Followers
Total: 10
1/2
| Name | Player Overlap | User Rating | Review Count | Original Price | Gross Revenue | Units Sold | Franchise |
|---|---|---|---|---|---|---|---|
| 11% | 90% | 721.49k | $9.99 | $88.77m | 23.11m | PAYDAY | |
| 15% | 88% | 2.17m | -- | $929.16m | 71.52m | Grand Theft Auto | |
| 16% | 87% | 1.05m | $59.99 | $1.92b | 54.84m | -- | |
| 18% | 82% | 452.09k | $19.99 | $133.23m | 21.84m | Fallout | |
| 12% | 82% | 1.66m | -- | $743.17m | 33.05m | Rainbow 6 Franchise, Tom Clancy Franchise |


* Based on players who follow this game, showing the games they also follow most. Higher player overlap means the two games share a more similar audience.
By Wishlists
Total: 10
1/2
| Name | Player Overlap | User Rating | Review Count | Original Price | Gross Revenue | Units Sold | Franchise |
|---|---|---|---|---|---|---|---|
| 16% | 87% | 1.05m | $59.99 | $1.92b | 54.84m | -- | |
| 13% | 92% | 982.30k | $59.99 | $336.63m | 28.35m | Red Dead Redemption | |
| 15% | 88% | 2.17m | -- | $929.16m | 71.52m | Grand Theft Auto | |
| 10% | 87% | 1.51m | $19.99 | $363.07m | 22.04m | -- | |
| 13% | 95% | 375.37k | $59.99 | $286.10m | 17.01m | -- |


* Based on players who have wishlisted this game, showing the games they also wishlist most. Higher player overlap means the two games share a more similar audience.