Released
Sekiro™: Shadows Die Twice - GOTY Edition
Sekiro™: Shadows Die Twice - GOTY Edition Stats & OverviewStore page details, rankings, sales estimates, and platform support

Game of the Year - The Game Awards 2019
Best Action Game of 2019 - IGN
Carve your own clever path to vengeance in the award winning adventure from developer FromSoftware, creators of Bloodborne and the Dark Souls series.
Take Revenge. Restore Your Honor. Kill Ingeniously.
Platforms

Product Type
Game
Release Date
21-03-2019
Developers
Recent Reviews
Very Positive (1.48k)
All Reviews
Overwhelming Positive (274.01k)
User Rating
94.63%
Current Average Daily CCU
1.47k
Wishlists
5.09m
Followers
649.33k
Top Sellers4128 (ATH:2)
Ranked 4128 on 14-11-2026.
Best: 2 on 14-01-2020, daily ranking
Best: 2 on 14-01-2020, daily ranking
Most Played-- (ATH:1)
Recently, it has not been on the daily ranking list.
Best: 1 on 21-03-2019, daily ranking
Best: 1 on 21-03-2019, daily ranking
Tags
Original Price
$59.99
Current Price
$59.99
Gross Revenue
$121.60m
Units Sold
3.01m
Player Modes
Controller Support
Content Rating

Achievements


Sekiro™: Shadows Die Twice - GOTY Edition Purchase Options & Price ComparisonBest Purchase Option: Sekiro: Shadows Die Twice
 China
¥268.00
 Hong Kong
HK$ 398.00
 South Korea
₩ 75,000
 Singapore
S$84.00
 Thailand
฿2,099.00
 Taiwan
NT$ 1,590.00
| Country | Original | Final | Discount | Ends in |
|---|---|---|---|---|
| China | ¥268.00 | - | - | - |
| Hong Kong | HK$ 398.00 | - | - | - |
| South Korea | ₩ 75,000 | - | - | - |
| Singapore | S$84.00 | - | - | - |
| Thailand | ฿2,099.00 | - | - | - |
| Taiwan | NT$ 1,590.00 | - | - | - |
Sekiro™: Shadows Die Twice - GOTY Edition Revenue & Sales EstimatesRegional sales, revenue, reviews and player trends over time
Period
Regional Analysis
Unlock game performance data including regional sales, revenue trends and player metrics over time.Upgrade to Starter →
Sales and Ratings
Unlock game performance data including regional sales, revenue trends and player metrics over time.Upgrade to Starter →
Regional Trends
Revenue & Units require Starter plan. Upgrade to Starter →Unit
Tiled Charts
Metrics
Review Count▼
Loading Regional Trends...
Regional Game Metrics
Revenue & Units require Starter plan. Upgrade to Starter →Total: 0
Sekiro™: Shadows Die Twice - GOTY Edition Videos & TrailersVideo coverage and creator analysis from YouTube
📹 481 videos👤 101 creators👁 52.7K views
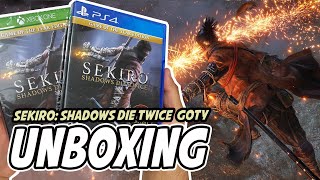 2:30
Sekiro: Shadows Die Twice GOTY Edition (PS4 / Xbox One) Unboxing
▶ 17.0K👍 339💬 47
POPnGAMES(82.3K subs)
Aug 16, 2022
 4:01
KONKR FIT Gaming Experience: Sekiro™: Shadows Die Twice - GOTY Edition
▶ 5.6K👍 139💬 28
AYANEO(28.0K subs)
Feb 10, 2026
 24:31
Gameplay starts straight into the brawl 01 - Sekiro Shadows Die Twice GOTY Edition
▶ 5.4K👍 0💬 0
Romar(64.3K subs)
 7:50
Cara Install Sekiro Shadows Die Twice GOTY Edition CODEX PC
▶ 4.4K👍 0💬 0
Rudianto
 14:03
Sekiro: Shadows Die Twice - GOTY Edition | Steam Deck Gameplay | Steam OS
▶ 2.9K👍 0💬 0
Factor of Games(13.7K subs)
 19:26
Sekiro: Shadows Die Twice - GOTY Edition Steam Deck Gameplay
▶ 1.6K👍 0💬 0
MarcdasPlays
 30:41
Boss Coruja (Pai) & Monja Corrompida Verdadeira 26 - Sekiro Shadows Die Twice GOTY Edition
▶ 1.1K👍 0💬 0
Romar(64.3K subs)
 46:31
Sekiro™ Shadows Die Twice GOTY Edition Game + Gameplay Part 1 Xbox Series X
▶ 608👍 0💬 0
My Channel(40.5K subs)
 0:54
Sekiro: Shadows Die Twice GOTY Edition Launch Trailer - PS4, Xbox One, PC
▶ 588👍 0💬 0
GamesTrack(1.2K subs)
 3:45
Sekiro: shadows die twice-GOTY Edition How to Cheese 🧀 Tokujiro the glutton
▶ 541👍 0💬 0
yasobig(73 subs)
 3:34:24
【耐久/SEKIRO】ボス倒すまで終われない!!#1【VTuber/シャラランラン/Sekiro™: Shadows Die Twice - GOTY Edition】
▶ 511👍 0💬 0
シャラランラン-絶叫美少女Vtuber-(335 subs)
 1:32
Sekiro: shadows die twice-GOTY Edition Easy Cheese 🧀 for Snake Eyes shirahagi
▶ 509👍 0💬 0
yasobig(73 subs)
 13:05
Sekiro Shadows Die Twice GOTY Edition RTX 2060 + i5 9400f Gameplay/FPS test 1080p (Max Settings)
▶ 428👍 0💬 0
absoluteALPHA
 6:58:36
【耐久/SEKIRO】腕の仇!!!!!!【女性VTuber/シャラランラン/Sekiro™: Shadows Die Twice - GOTY Edition】
▶ 398👍 0💬 0
シャラランラン-絶叫美少女Vtuber-(335 subs)
 7:43:27
Sekiro Shadows Die Twice - GOTY Edition FullGames
▶ 373👍 0💬 0
ATGaming
 4:55:39
【ラスボス戦/SEKIRO】一心様リベンジ!!!!【女性VTuber/シャラランラン/Sekiro™: Shadows Die Twice - GOTY Edition】
▶ 355👍 0💬 0
シャラランラン-絶叫美少女Vtuber-(335 subs)
 10:50
Teste Pc Gamer Custo Benefício 2020 - SEKIRO: SHADOWS DIE TWICE - GOTY Edition 1080p 60Fps No máximo
▶ 328👍 0💬 0
LUCACO MACHINE GAME
 2:59:12
【5】- SEKIRO - SHADOWS DIE TWICE // GOTY EDITION ギュイーントクガワはクリアまでコツコツやる
▶ 312👍 0💬 0
RENDA - ギュイーントクガワのゲーム配信(218 subs)
 3:26
Sekiro Shadows Die Twice GOTY Edition PS4 Türkçe Yama
▶ 252👍 0💬 0
LEGEND GAMES
 7:30:55
【耐久/SEKIRO】初見でまぼろしお蝶サクサク討伐!?【VTuber/シャラランラン/Sekiro™: Shadows Die Twice - GOTY Edition】
▶ 238👍 0💬 0
シャラランラン-絶叫美少女Vtuber-(335 subs)
Is Sekiro™: Shadows Die Twice - GOTY Edition Worth It? Player Reviews AnalyzedAI-powered summary, highlights, dimensional insights and SWOT analysis
"Players widely appreciate the game's artistic design, creativity, and overall concept, highlighting the challenging yet enjoyable gameplay with fast-paced combat and engaging mechanics, while significant issues like poor PC performance, excessive load times, and frequent freezing disrupt the experience, alongside mixed feelings regarding gameplay depth compared to titles like Elden Ring, as many players find navigation frustrating due to a lack of maps or guidance, and some express dissatisfaction with the character designs and necessity for improvement in graphical performance, despite acknowledging impressive visuals and unique aesthetic scenes; in addition, while sound effects contribute positively to immersion, there are calls for varied background music and improved voice acting clarity, indicating that although the title showcases a storytelling proficiency that captivates players emotionally, essential gameplay elements need enhancements for a more cohesive experience that achieves higher replayability, as post-completion interest appears diminished due to a grinding process for achievements and the absence of more engaging content for multiple playthroughs, leading to contrasting perceptions where seasoned players may not find the game's lasting value compared to newcomers who might enjoy the surface elements."
Unlock AI-powered review analysis to discover player sentiment, strengths, weaknesses, multi-dimensional insights and market positioning for this game.
Upgrade to Pro →Sekiro™: Shadows Die Twice - GOTY Edition Steam Rank HistoryGame ranking by indicators and genres among all Steam games
Unlock ranking data to see how this game performs across all Steam titles by key indicators and genres.
Upgrade to Starter →Games Like Sekiro™: Shadows Die Twice - GOTY EditionBased on similar characteristics and audience overlap
Total: 68
1/14
| Name | User Rating | Review Count | Original Price | Gross Revenue | Units Sold | Franchise |
|---|---|---|---|---|---|---|
| 94% | 402.11k | $39.99 | $218.75m | 38.19m | The Elder Scrolls, Skyrim | |
| 78% | 35.62k | $49.99 | $136.62m | 4.70m | FINAL FANTASY | |
| 93% | 22.93k | $29.99 | $88.95m | 4.51m | -- | |
| 91% | 230.11k | $29.99 | $217.88m | 20.10m | DOOM | |
| 91% | 88.22k | $59.99 | $149.85m | 7.57m | -- |


What Else Do Sekiro™: Shadows Die Twice - GOTY Edition Players Also Play?Based on real player follow and wishlist data
By Followers
Total: 10
1/2
| Name | Player Overlap | User Rating | Review Count | Original Price | Gross Revenue | Units Sold | Franchise |
|---|---|---|---|---|---|---|---|
| 22% | 87% | 1.05m | $59.99 | $1.92b | 54.84m | -- | |
| 22% | 92% | 1.22m | $59.99 | $4.33b | 132.95m | -- | |
| 9% | 90% | 721.49k | $9.99 | $88.77m | 23.11m | PAYDAY | |
| 18% | 89% | 538.14k | $29.99 | $565.16m | 39.11m | Monster Hunter | |
| 20% | 94% | 464.64k | $59.99 | $205.22m | 11.66m | Dark Souls |


* Based on players who follow this game, showing the games they also follow most. Higher player overlap means the two games share a more similar audience.
By Wishlists
Total: 10
1/2
| Name | Player Overlap | User Rating | Review Count | Original Price | Gross Revenue | Units Sold | Franchise |
|---|---|---|---|---|---|---|---|
| 22% | 87% | 1.05m | $59.99 | $1.92b | 54.84m | -- | |
| 22% | 92% | 1.22m | $59.99 | $4.33b | 132.95m | -- | |
| 18% | 92% | 982.30k | $59.99 | $336.63m | 28.35m | Red Dead Redemption | |
| 20% | 94% | 464.64k | $59.99 | $205.22m | 11.66m | Dark Souls | |
| 14% | 79% | 236.31k | $59.99 | $908.63m | 50.73m | Dying Light |


* Based on players who have wishlisted this game, showing the games they also wishlist most. Higher player overlap means the two games share a more similar audience.