Released
Resident Evil 4
Resident Evil 4 Stats & OverviewStore page details, rankings, sales estimates, and platform support

Survival is just the beginning.
Six years have passed since the biological disaster in Raccoon City.
Leon S. Kennedy, one of the survivors, tracks the president's kidnapped daughter
to a secluded European village, where there is something terribly wrong with the locals.
Platforms

Product Type
Game
Franchise
Resident Evil
Recent Reviews
Overwhelming Positive (4.21k)
All Reviews
Overwhelming Positive (202.76k)
User Rating
97%
Current Average Daily CCU
7.76k
Wishlists
2.18m
Followers
329.69k
Top Sellers1111 (ATH:1)
Ranked 1111 on 14-11-2026.
Best: 1 on 19-06-2023, daily ranking
Best: 1 on 19-06-2023, daily ranking
Most Played-- (ATH:2)
Recently, it has not been on the daily ranking list.
Best: 2 on Invalid Date, overall ranking
Best: 2 on Invalid Date, overall ranking
Tags
Original Price
$39.99
Current Price
$39.99
Gross Revenue
$81.14m
Units Sold
2.14m
Player Modes
Controller Support
Achievements





Resident Evil 4 Purchase Options & Price ComparisonBest Purchase Option: Resident Evil 4
 United States
$39.99
 Austria
39,99€
 Australia
A$ 59.95
 Belgium
39,99€
 Brazil
R$169,00
 Canada
C$ 59.99
 Switzerland
CHF 39.90
 China
¥198.00
 Czechia
39,99€
 Germany
39,99€
 Denmark
39,99€
 Spain
39,99€
 Finland
39,99€
 France
39,99€
 United Kingdom
£34.99
 Hong Kong
HK$ 298.00
 Italy
39,99€
 Japan
 South Korea
₩ 49,800
 Netherlands
39,99€
 Norway
449,00 kr
 New Zealand
NZ$ 63.96
 Poland
169,00 zł
 Sweden
39,99€
 Singapore
S$49.90
 Thailand
฿1,090.00
 Türkiye
$29.99
 Taiwan
NT$ 1,190.00
| Country | Original | Final | Discount | Ends in |
|---|---|---|---|---|
| United States | $39.99 | - | - | - |
| Austria | 39,99€ | - | - | - |
| Australia | A$ 59.95 | - | - | - |
| Belgium | 39,99€ | - | - | - |
| Brazil | R$169,00 | - | - | - |
| Canada | C$ 59.99 | - | - | - |
| Switzerland | CHF 39.90 | - | - | - |
| China | ¥198.00 | - | - | - |
| Czechia | 39,99€ | - | - | - |
| Germany | 39,99€ | - | - | - |
| Denmark | 39,99€ | - | - | - |
| Spain | 39,99€ | - | - | - |
| Finland | 39,99€ | - | - | - |
| France | 39,99€ | - | - | - |
| United Kingdom | £34.99 | - | - | - |
| Hong Kong | HK$ 298.00 | - | - | - |
| Italy | 39,99€ | - | - | - |
| Japan | - | - | - | - |
| South Korea | ₩ 49,800 | - | - | - |
| Netherlands | 39,99€ | - | - | - |
| Norway | 449,00 kr | - | - | - |
| New Zealand | NZ$ 63.96 | - | - | - |
| Poland | 169,00 zł | - | - | - |
| Sweden | 39,99€ | - | - | - |
| Singapore | S$49.90 | - | - | - |
| Thailand | ฿1,090.00 | - | - | - |
| Türkiye | $29.99 | - | - | - |
| Taiwan | NT$ 1,190.00 | - | - | - |
Resident Evil 4 Revenue & Sales EstimatesRegional sales, revenue, reviews and player trends over time
Period
Regional Analysis
Unlock game performance data including regional sales, revenue trends and player metrics over time.Upgrade to Starter →
Sales and Ratings
Unlock game performance data including regional sales, revenue trends and player metrics over time.Upgrade to Starter →
Regional Trends
Revenue & Units require Starter plan. Upgrade to Starter →Unit
Tiled Charts
Metrics
Review Count▼
Loading Regional Trends...
Regional Game Metrics
Revenue & Units require Starter plan. Upgrade to Starter →Total: 0
Resident Evil 4 DLC Revenue & SalesSales, pricing, review and player metrics for each DLC
Unlock DLC performance data including sales, pricing, review distribution and player metrics for each DLC.
Upgrade to Pro →Resident Evil 4 Videos & TrailersVideo coverage and creator analysis from YouTube
📹 4379 videos👤 1455 creators👁 732.7M views
 45:35
WELCOME TO THE ZOMBIES VILLAGE | RESIDENT EVIL 4 GAMEPLAY #1
▶ 13.7M👍 559.6K💬 26.1K
Techno Gamerz(51.9M subs)
Apr 21, 2023
 31:37
THE CHAINSAW ZOMBIE MONSTER | RESIDENT EVIL 4 GAMEPLAY #2
▶ 13.5M👍 423.4K💬 13.9K
Techno Gamerz(51.9M subs)
Apr 28, 2023
 49:51
off to a GREAT START :) Resident Evil 4 Remake - Part 1 [HARDCORE]
▶ 11.0M👍 453.5K💬 19.2K
CoryxKenshin(24.4M subs)
Mar 25, 2023
 5:28
Resident Ivol - Episodio 1 (Parodia de Resident Evil 4)
▶ 10.7M👍 214.6K💬 6.0K
Hagen Wolfhowl(1.0M subs)
Mar 15, 2013
 1:06:21
my hardest recording session | Resident Evil 4 Remake - Part 3
▶ 10.2M👍 414.6K💬 18.8K
CoryxKenshin(24.4M subs)
Apr 25, 2023
 10:50
Resident Ivol - Episodio 3 (Parodia de Resident Evil 4)
▶ 9.8M👍 239.8K💬 23.2K
Hagen Wolfhowl(1.0M subs)
Dec 14, 2015
 40:36
THIS SEA MONSTER IS CRAZY | RESIDENT EVIL 4 GAMEPLAY #3
▶ 9.7M👍 404.5K💬 13.0K
Techno Gamerz(51.9M subs)
Apr 30, 2023
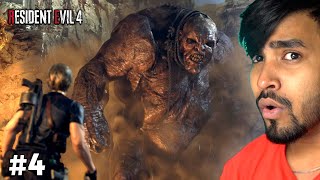 36:04
THE GIANT MONSTER BOSS FIGHT | RESIDENT EVIL 4 GAMEPLAY #4
▶ 8.9M👍 355.4K💬 12.8K
Techno Gamerz(51.9M subs)
May 7, 2023
 38:54
THIS MONSTER IS CRAZY! | RESIDENT EVIL 4 GAMEPLAY #6
▶ 8.9M👍 360.5K💬 16.4K
Techno Gamerz(51.9M subs)
May 14, 2023
 42:27
THE GIANT MONSTERS IS BACK | RESIDENT EVIL 4 GAMEPLAY #11
▶ 8.6M👍 307.5K💬 25.0K
Techno Gamerz(51.9M subs)
Oct 28, 2023
 3:59
Resident Ivol - Episodio 2 (Parodia de Resident Evil 4)
▶ 8.3M👍 151.6K💬 6.7K
Hagen Wolfhowl(1.0M subs)
Oct 24, 2013
 52:19
ASHLEY.. more like BAEshley.. dont unsub | Resident Evil 4 Remake - Part 2
▶ 8.1M👍 309.6K💬 21.3K
CoryxKenshin(24.4M subs)
Mar 29, 2023
 35:05
THE BIG MONSTER OF CASTLE | RESIDENT EVIL 4 GAMEPLAY #8
▶ 7.8M👍 324.1K💬 22.0K
Techno Gamerz(51.9M subs)
Jun 22, 2023
 10:49:31
RESIDENT EVIL 4 - Full Game Professional Walkthrough Longplay Gameplay No Commentary
▶ 7.7M👍 84.9K💬 4.6K
Gamer Max Channel(518.0K subs)
Mar 8, 2018
 32:07
THE HORROR FACTORY OF ZOMBIES | RESIDENT EVIL 4 GAMEPLAY #13
▶ 7.5M👍 275.4K💬 18.6K
Techno Gamerz(51.9M subs)
May 19, 2024
 24:51
CAN I RESCUE GIRL FROM ZOMBIES ? | RESIDENT EVIL 4 GAMEPLAY #5
▶ 7.0M👍 322.4K💬 11.4K
Techno Gamerz(51.9M subs)
May 9, 2023
 53:38
30 CURIOSIDADES FLIPANTES DE RESIDENT EVIL 4 REMAKE
▶ 6.7M👍 221.6K💬 4.7K
JWulen(4.4M subs)
Apr 30, 2023
 1:26:17
IT'S BINGO TIME | Resident Evil 4 Remake - Part 1
▶ 6.6M👍 178.4K💬 5.6K
jacksepticeye(31.2M subs)
Mar 25, 2023
 29:38
THIS MONSTER IS VERY CREEPY | RESIDENT EVIL 4 GAMEPLAY #12
▶ 6.5M👍 286.8K💬 24.3K
Techno Gamerz(51.9M subs)
May 18, 2024
 12:48
Resident Evil 4 I La Historia en 1 Video
▶ 6.4M👍 212.7K💬 4.4K
El Fedelobo(8.4M subs)
Dec 24, 2018
Creators also play these games
 $19.99
Resident Evil
Very Positive39.3K reviews
76 shared creators
 $39.99
Resident Evil 3
Very Positive135.2K reviews
97 shared creators
 $69.99
Resident Evil Requiem
Overwhelming Positive194.1K reviews
88 shared creators
 $39.99
Resident Evil 2
Overwhelming Positive238.8K reviews
91 shared creators
 $69.99
SILENT HILL 2
Very Positive70.7K reviews
50 shared creators
 $19.99
Umbrella Corps
Mostly Negative3.5K reviews
16 shared creators
 $4.99
Resident Evil 0
Very Positive21.4K reviews
28 shared creators
 $19.99
Resident Evil 5
Very Positive73.2K reviews
57 shared creators
 $39.99
SILENT HILL f
Very Positive31.4K reviews
57 shared creators
 $19.99
Resident Evil 6
Mostly Positive76.6K reviews
53 shared creators
Is Resident Evil 4 Worth It? Player Reviews AnalyzedAI-powered summary, highlights, dimensional insights and SWOT analysis
"The game receives notable acclaim for its exceptional performance on high settings, achieving stable 60 fps even with ray tracing, successfully retaining the charm and enhancing the performance of the original, and creating a tense horror atmosphere through effective environment and music design; however, it faces substantial criticism for significant performance issues such as low image quality and severe FPS drops when using the sniper scope, frequent launch failures and system crashes, and gameplay challenges like the requirement for multiple headshots to eliminate enemies, which has led some players to express frustration with the difficulty levels that may not suit beginners while also noting a need for more innovation and engaging gameplay to avoid a sense of burnout and capture the essence of the original more effectively."
Unlock AI-powered review analysis to discover player sentiment, strengths, weaknesses, multi-dimensional insights and market positioning for this game.
Upgrade to Pro →Resident Evil 4 Steam Rank HistoryGame ranking by indicators and genres among all Steam games
Unlock ranking data to see how this game performs across all Steam titles by key indicators and genres.
Upgrade to Starter →Games Like Resident Evil 4Based on similar characteristics and audience overlap
Total: 49
1/10
| Name | User Rating | Review Count | Original Price | Gross Revenue | Units Sold | Franchise |
|---|---|---|---|---|---|---|
| 97% | 152.78k | $14.99 | $21.29m | 4.23m | Outlast | |
| 91% | 88.64k | $1.99 | $5.83m | 2.13m | Metro | |
| 92% | 123.38k | $39.99 | $225.75m | 12.45m | PlayStation Studios | |
| 95% | 731.87k | $3.99 | $118.37m | 19.13m | -- | |
| 69% | 77.24k | $59.99 | $294.42m | 26.02m | WB Games |


What Else Do Resident Evil 4 Players Also Play?Based on real player follow and wishlist data
By Followers
Total: 10
1/2
| Name | Player Overlap | User Rating | Review Count | Original Price | Gross Revenue | Units Sold | Franchise |
|---|---|---|---|---|---|---|---|
| 15% | 87% | 1.05m | $59.99 | $1.92b | 54.84m | -- | |
| 18% | 92% | 1.22m | $59.99 | $4.33b | 132.95m | -- | |
| 17% | 97% | 238.78k | $39.99 | $175.48m | 9.94m | Resident Evil | |
| 8% | 90% | 721.49k | $9.99 | $88.77m | 23.11m | PAYDAY | |
| 15% | 96% | 890.32k | $59.99 | $3.70b | 105.48m | Baldur's Gate |


* Based on players who follow this game, showing the games they also follow most. Higher player overlap means the two games share a more similar audience.
By Wishlists
Total: 10
1/2
| Name | Player Overlap | User Rating | Review Count | Original Price | Gross Revenue | Units Sold | Franchise |
|---|---|---|---|---|---|---|---|
| 22% | 85% | 118.77k | $59.99 | $281.97m | 8.00m | The Last of Us Franchise, 45527500 | |
| 18% | 92% | 1.22m | $59.99 | $4.33b | 132.95m | -- | |
| 16% | 89% | 394.32k | $59.99 | $1.85b | 52.74m | WB Games | |
| 15% | 96% | 890.32k | $59.99 | $3.70b | 105.48m | Baldur's Gate | |
| 17% | 96% | 195.54k | $49.99 | $512.75m | 24.46m | PlayStation Studios, God of War |


* Based on players who have wishlisted this game, showing the games they also wishlist most. Higher player overlap means the two games share a more similar audience.