Released
ONE PIECE: PIRATE WARRIORS 4
ONE PIECE: PIRATE WARRIORS 4 Stats & OverviewStore page details, rankings, sales estimates, and platform support

Step into the world of One Piece like never before in Pirate Warriors 4! Unleash devastating attacks against massive enemy armies and relive iconic anime arcs in an action-packed adventure. With stunning visuals, fast-paced combat, and fan-favorite characters, experience a One Piece power fantasy.
Platforms

Product Type
Game
Recent Reviews
Very Positive (99)
All Reviews
Very Positive (18.23k)
User Rating
91.54%
Email
Current Average Daily CCU
196
Wishlists
436.67k
Followers
82.96k
Top Sellers4868 (ATH:41)
Ranked 4868 on 20-11-2026.
Best: 41 on 29-03-2020, daily ranking
Best: 41 on 29-03-2020, daily ranking
Most Played692 (ATH:11)
Ranked 692 on 20-11-2026.
Best: 11 on 28-03-2020, daily ranking
Best: 11 on 28-03-2020, daily ranking
Genres
Original Price
$64.99
Current Price
$39.99 (-38%)
Gross Revenue
$15.69m
Units Sold
937.02k
Player Modes
Controller Support
Content Rating

Achievements


ONE PIECE: PIRATE WARRIORS 4 Purchase Options & Price ComparisonBest Purchase Option: ONE PIECE: PIRATE WARRIORS 4
 United States
$39.99
 Austria
39,99€
 Australia
A$ 54.95
 Belgium
39,99€
 Brazil
R$169,50
 Canada
C$ 53.49
 Switzerland
CHF 39.90
 China
¥178.00
 Czechia
39,99€
 Germany
39,99€
 Denmark
39,99€
 Spain
39,99€
 Finland
39,99€
 France
39,99€
 United Kingdom
£34.99
 Hong Kong
HK$ 299.00
 Italy
39,99€
 South Korea
₩ 49,800
 Netherlands
39,99€
 Norway
449,00 kr
 New Zealand
NZ$ 69.95
 Poland
169,00 zł
 Russia
2849 руб
 Sweden
39,99€
 Singapore
S$49.90
 Thailand
฿1,190.00
 Türkiye
$26.39
 Taiwan
NT$ 1,190.00
| Country | Original | Final | Discount | Ends in |
|---|---|---|---|---|
| United States | $39.99 | - | - | - |
| Austria | 39,99€ | - | - | - |
| Australia | A$ 54.95 | - | - | - |
| Belgium | 39,99€ | - | - | - |
| Brazil | R$169,50 | - | - | - |
| Canada | C$ 53.49 | - | - | - |
| Switzerland | CHF 39.90 | - | - | - |
| China | ¥178.00 | - | - | - |
| Czechia | 39,99€ | - | - | - |
| Germany | 39,99€ | - | - | - |
| Denmark | 39,99€ | - | - | - |
| Spain | 39,99€ | - | - | - |
| Finland | 39,99€ | - | - | - |
| France | 39,99€ | - | - | - |
| United Kingdom | £34.99 | - | - | - |
| Hong Kong | HK$ 299.00 | - | - | - |
| Italy | 39,99€ | - | - | - |
| South Korea | ₩ 49,800 | - | - | - |
| Netherlands | 39,99€ | - | - | - |
| Norway | 449,00 kr | - | - | - |
| New Zealand | NZ$ 69.95 | - | - | - |
| Poland | 169,00 zł | - | - | - |
| Russia | 2849 руб | - | - | - |
| Sweden | 39,99€ | - | - | - |
| Singapore | S$49.90 | - | - | - |
| Thailand | ฿1,190.00 | - | - | - |
| Türkiye | $26.39 | - | - | - |
| Taiwan | NT$ 1,190.00 | - | - | - |
ONE PIECE: PIRATE WARRIORS 4 Revenue & Sales EstimatesRegional sales, revenue, reviews and player trends over time
Period
Regional Analysis
Unlock game performance data including regional sales, revenue trends and player metrics over time.Upgrade to Starter →
Sales and Ratings
Unlock game performance data including regional sales, revenue trends and player metrics over time.Upgrade to Starter →
Regional Trends
Revenue & Units require Starter plan. Upgrade to Starter →Unit
Tiled Charts
Metrics
Review Count▼
Loading Regional Trends...
Regional Game Metrics
Revenue & Units require Starter plan. Upgrade to Starter →Total: 0
ONE PIECE: PIRATE WARRIORS 4 DLC Revenue & SalesSales, pricing, review and player metrics for each DLC
Unlock DLC performance data including sales, pricing, review distribution and player metrics for each DLC.
Upgrade to Pro →ONE PIECE: PIRATE WARRIORS 4 Videos & TrailersVideo coverage and creator analysis from YouTube
📹 1370 videos👤 404 creators👁 130.2M views
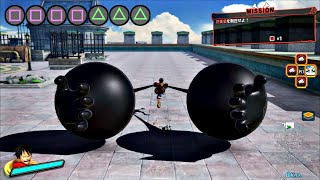 11:30
ONE PIECE Pirate Warriors 4 - MONKEY.D.LUFFY Complete Moveset
▶ 21.4M👍 181.4K💬 3.6K
Sigma Games(147.0K subs)
 12:18
ONE PIECE: PIRATE WARRIORS 4 Comparing Post-Timeskip Luffy Attacks to Anime
▶ 7.0M👍 59.1K💬 736
Rtrixxツ(18.1K subs)
Jul 13, 2021
 7:26
【海賊無双4】ルフィ"ギア5" モーション集【ONE PIECE Pirate Warriors 4】
▶ 6.9M👍 54.3K💬 1.6K
Sigma Games(147.0K subs)
Sep 13, 2023
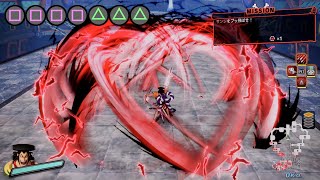 5:23
【海賊無双4】光月おでん モーション集【ONE PIECE Pirate Warriors 4】
▶ 5.0M👍 35.1K💬 1.8K
Sigma Games(147.0K subs)
Dec 17, 2020
 12:44
ONE PIECE: PIRATE WARRIORS 4 Comparing Pre-Timeskip Luffy's Attacks to Anime
▶ 3.2M👍 26.3K💬 615
Rtrixxツ(18.1K subs)
Jul 8, 2021
 10:45
ONE PIECE Pirate Warriors 4 - All Luffy Transformations Gear 1-5 & Ultimate Attacks (4K 60fps)
▶ 2.6M👍 22.5K💬 392
RikudouFox(977.0K subs)
 12:58
One Piece Pirate Warriors 4 - Luffy (Gear 1-5) Complete Moveset
▶ 2.5M👍 21.7K💬 403
GameBurst(134.0K subs)
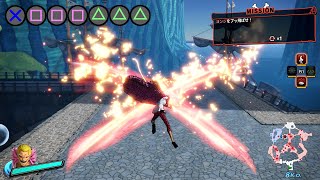 4:27
【海賊無双4】ドンキホーテ・ドフラミンゴ モーション集 【ONE PIECE Pirate Warriors 4】
▶ 2.5M👍 19.1K💬 832
Sigma Games(147.0K subs)
Apr 11, 2020
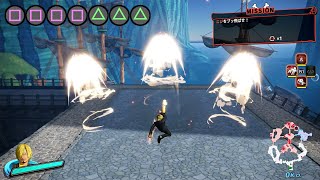 8:28
【海賊無双4】サンジ モーション集 【ONE PIECE Pirate Warriors 4】
▶ 2.3M👍 21.6K💬 803
Sigma Games(147.0K subs)
Apr 12, 2020
 3:41
【海賊無双4】マルコ モーション集【ONE PIECE Pirate Warriors 4】
▶ 2.2M👍 21.3K💬 913
Sigma Games(147.0K subs)
Apr 15, 2020
 3:30
【海賊無双4】トニートニー・チョッパー モーション集【ONE PIECE Pirate Warriors 4】
▶ 1.8M👍 15.9K💬 639
Sigma Games(147.0K subs)
Apr 15, 2020
 2:15:53
[One Piece: Pirate Warriors 4] All Major Boss Battles!!
▶ 1.8M👍 14.3K💬 357
Kapoownug(7.5K subs)
 5:53
【海賊無双4】カイドウ "人獣型" モーション集【ONE PIECE Pirate Warriors 4】
▶ 1.7M👍 13.1K💬 634
Sigma Games(147.0K subs)
Sep 14, 2023
 9:23
ONE PIECE: Pirate Warriors 4 - Gear 5 Luffy Complete Moveset (4K 60fps)
▶ 1.6M👍 13.0K💬 298
RikudouFox(977.0K subs)
 6:27
【海賊無双4】シャーロット・クラッカー モーション集【ONE PIECE Pirate Warriors 4】
▶ 1.6M👍 10.6K💬 625
Sigma Games(147.0K subs)
Jul 22, 2020
 6:14
【海賊無双4】ゴール・D・ロジャー モーション集【ONE PIECE Pirate Warriors 4】
▶ 1.6M👍 12.3K💬 698
Sigma Games(147.0K subs)
Mar 27, 2024
 5:30
【海賊無双4】カポネ・ベッジ モーション集【ONE PIECE Pirate Warriors 4】
▶ 1.6M👍 8.8K💬 607
Sigma Games(147.0K subs)
Apr 14, 2020
 4:53
【海賊無双4】バギー モーション集【ONE PIECE Pirate Warriors 4】
▶ 1.4M👍 11.2K💬 675
Sigma Games(147.0K subs)
Apr 20, 2020
 55:55
Luffy vs Kaido Final Battle - Land of Wano Arc | One Piece: Pirate Warriors 4 Final Episode
▶ 1.3M👍 6.0K💬 161
Edoen Gaming(2.3K subs)
 7:11
One Piece: Pirate Warriors 4 Review
▶ 1.3M👍 15.6K💬 1.2K
IGN(19.8M subs)
Creators also play these games
 $39.99
One Piece Pirate Warriors 3
Mostly Positive11.5K reviews
28 shared creators
 $19.99
DRAGON BALL Z: KAKAROT
Very Positive61.1K reviews
33 shared creators
 $39.99
Little Witch Academia: Chamber of Time
Mostly Positive1.5K reviews
7 shared creators
 $59.99
WARRIORS OROCHI 4
Very Positive5.8K reviews
11 shared creators
 $29.99
NARUTO SHIPPUDEN: Ultimate Ninja STORM Revolution
Very Positive9.6K reviews
10 shared creators
 $21.24
SD GUNDAM BATTLE ALLIANCE
Mixed6.3K reviews
18 shared creators
 $59.99
BERSERK and the Band of the Hawk
Very Positive4.5K reviews
8 shared creators
 $53.99
CODE VEIN II
Mixed8.3K reviews
6 shared creators
 $17.99
DYNASTY WARRIORS 9
Mostly Negative10.5K reviews
13 shared creators
 $59.99
SAMURAI WARRIORS 5
Very Positive1.7K reviews
16 shared creators
Is ONE PIECE: PIRATE WARRIORS 4 Worth It? Player Reviews AnalyzedAI-powered summary, highlights, dimensional insights and SWOT analysis
Unlock AI-powered review analysis to discover player sentiment, strengths, weaknesses, multi-dimensional insights and market positioning for this game.
Upgrade to Pro →ONE PIECE: PIRATE WARRIORS 4 Steam Rank HistoryGame ranking by indicators and genres among all Steam games
Unlock ranking data to see how this game performs across all Steam titles by key indicators and genres.
Upgrade to Starter →Games Like ONE PIECE: PIRATE WARRIORS 4Based on similar characteristics and audience overlap
Total: 31
1/7
| Name | User Rating | Review Count | Original Price | Gross Revenue | Units Sold | Franchise |
|---|---|---|---|---|---|---|
| 64% | 21.29k | -- | $64.40m | 12.93m | -- | |
| 70% | 1.64k | $12.49 | $560.75k | 54.44k | -- | |
| 96% | 150.47k | $14.99 | $18.23m | 5.13m | -- | |
| 74% | 8.61k | $29.99 | $1.45m | 81.54k | -- | |
| 75% | 4.00k | $4.94 | $2.39m | 301.04k | -- |


What Else Do ONE PIECE: PIRATE WARRIORS 4 Players Also Play?Based on real player follow and wishlist data
By Followers
Total: 10
1/2
| Name | Player Overlap | User Rating | Review Count | Original Price | Gross Revenue | Units Sold | Franchise |
|---|---|---|---|---|---|---|---|
| 15% | 87% | 1.05m | $59.99 | $1.92b | 54.88m | -- | |
| 13% | 95% | 375.73k | $59.99 | $286.15m | 17.01m | -- | |
| 12% | 92% | 1.22m | $59.99 | $4.33b | 132.95m | -- | |
| 10% | 89% | 538.41k | $29.99 | $565.20m | 39.11m | Monster Hunter | |
| 12% | 92% | 984.30k | $59.99 | $336.90m | 28.36m | Red Dead Redemption |


* Based on players who follow this game, showing the games they also follow most. Higher player overlap means the two games share a more similar audience.
By Wishlists
Total: 10
1/2
| Name | Player Overlap | User Rating | Review Count | Original Price | Gross Revenue | Units Sold | Franchise |
|---|---|---|---|---|---|---|---|
| 15% | 87% | 1.05m | $59.99 | $1.92b | 54.88m | -- | |
| 13% | 95% | 375.73k | $59.99 | $286.15m | 17.01m | -- | |
| 12% | 92% | 1.22m | $59.99 | $4.33b | 132.95m | -- | |
| 9% | 89% | 394.77k | $59.99 | $1.85b | 52.75m | WB Games | |
| 12% | 92% | 984.30k | $59.99 | $336.90m | 28.36m | Red Dead Redemption |

* Based on players who have wishlisted this game, showing the games they also wishlist most. Higher player overlap means the two games share a more similar audience.