Released
Total War: PHARAOH
Total War: PHARAOH Stats & OverviewStore page details, rankings, sales estimates, and platform support

In Total War: PHARAOH, the newest entry in the award-winning grand strategy series, immerse yourself in ancient Egypt at the zenith of its power and experience the dramatic events that threaten its destruction.
Platforms

Product Type
Game
Franchise
Total War
Recent Reviews
7
All Reviews
Mixed (3.75k)
User Rating
63.08%
Current Average Daily CCU
13
Wishlists
163.09k
Followers
43.38k
Top Sellers-- (ATH:12)
Recently, it has not been on the daily ranking list.
Best: 12 on 25-10-2023, daily ranking
Best: 12 on 25-10-2023, daily ranking
Most Played-- (ATH:160)
Recently, it has not been on the daily ranking list.
Best: 160 on 12-10-2023, daily ranking
Best: 160 on 12-10-2023, daily ranking
Tags
Original Price
$29.98
Current Price
$29.99
Gross Revenue
$4.40m
Units Sold
122.08k
Player Modes
Content Rating

Achievements




Total War: PHARAOH Purchase Options & Price ComparisonBest Purchase Option: Total War: PHARAOH - Standard Edition
 United States
$29.99
 Austria
29,99€
 Australia
A$ 36.95
 Belgium
29,99€
 Brazil
R$99,90
 Canada
C$ 39.99
 Switzerland
CHF 29.90
 China
¥98.00
 Czechia
29,99€
 Germany
29,99€
 Denmark
29,99€
 Spain
29,99€
 Finland
29,99€
 France
29,99€
 United Kingdom
£24.99
 Hong Kong
HK$ 145.00
 Italy
29,99€
 Japan
¥2,990
 South Korea
₩ 26,900
 Netherlands
29,99€
 Norway
299,00 kr
 New Zealand
NZ$ 44.95
 Poland
89,99 zł
 Sweden
29,99€
 Singapore
S$24.90
 Thailand
฿429.00
 Türkiye
$18.99
 Taiwan
NT$ 599.00
| Country | Original | Final | Discount | Ends in |
|---|---|---|---|---|
| United States | $29.99 | - | - | - |
| Austria | 29,99€ | - | - | - |
| Australia | A$ 36.95 | - | - | - |
| Belgium | 29,99€ | - | - | - |
| Brazil | R$99,90 | - | - | - |
| Canada | C$ 39.99 | - | - | - |
| Switzerland | CHF 29.90 | - | - | - |
| China | ¥98.00 | - | - | - |
| Czechia | 29,99€ | - | - | - |
| Germany | 29,99€ | - | - | - |
| Denmark | 29,99€ | - | - | - |
| Spain | 29,99€ | - | - | - |
| Finland | 29,99€ | - | - | - |
| France | 29,99€ | - | - | - |
| United Kingdom | £24.99 | - | - | - |
| Hong Kong | HK$ 145.00 | - | - | - |
| Italy | 29,99€ | - | - | - |
| Japan | ¥2,990 | - | - | - |
| South Korea | ₩ 26,900 | - | - | - |
| Netherlands | 29,99€ | - | - | - |
| Norway | 299,00 kr | - | - | - |
| New Zealand | NZ$ 44.95 | - | - | - |
| Poland | 89,99 zł | - | - | - |
| Sweden | 29,99€ | - | - | - |
| Singapore | S$24.90 | - | - | - |
| Thailand | ฿429.00 | - | - | - |
| Türkiye | $18.99 | - | - | - |
| Taiwan | NT$ 599.00 | - | - | - |
Total War: PHARAOH Revenue & Sales EstimatesRegional sales, revenue, reviews and player trends over time
Period
Regional Analysis
Unlock game performance data including regional sales, revenue trends and player metrics over time.Upgrade to Starter →
Sales and Ratings
Unlock game performance data including regional sales, revenue trends and player metrics over time.Upgrade to Starter →
Regional Trends
Revenue & Units require Starter plan. Upgrade to Starter →Unit
Tiled Charts
Metrics
Review Count▼
Loading Regional Trends...
Regional Game Metrics
Revenue & Units require Starter plan. Upgrade to Starter →Total: 0
Total War: PHARAOH DLC Revenue & SalesSales, pricing, review and player metrics for each DLC
Unlock DLC performance data including sales, pricing, review distribution and player metrics for each DLC.
Upgrade to Pro →Total War: PHARAOH Videos & TrailersVideo coverage and creator analysis from YouTube
📹 780 videos👤 162 creators👁 15.7M views
 1:55
Total War: PHARAOH - Announce Trailer
▶ 3.7M👍 25.7K💬 5.5K
Total War(578.0K subs)
May 23, 2023
 0:09
Seeing Total War Pharaoh's Map for the first time
▶ 1.0M👍 11.7K💬 542
HappyCompyTW(15.8K subs)
Oct 16, 2023
 12:53
First look & impressions of Total War: Pharaoh Battles!
▶ 463.9K👍 9.3K💬 1.9K
Zerkovich(298.0K subs)
Jun 1, 2023
 31:28
Total War: Pharaoh Post Mortem
▶ 414.0K👍 13.4K💬 2.8K
LegendofTotalWar(559.0K subs)
Oct 13, 2023
 16:52
NOT WORTH $60: Total War Pharaoh Fails In Almost Every Way
▶ 406.1K👍 12.2K💬 2.2K
STRATMAN(65.5K subs)
Oct 10, 2023
 1:16:15
THE GREAT RAMESSES RISES AGAIN! Total War: Pharaoh - Ramesses Campaign #1
▶ 404.8K👍 5.3K💬 430
lionheartx10(490.0K subs)
Sep 21, 2023
 17:45
I'M ACTUALLY SHOCKED | TOTAL WAR PHARAOH DYNASTIES REVIEW
▶ 351.1K👍 7.2K💬 935
Andy's Take(75.2K subs)
Jul 24, 2024
 23:25
Total War: PHARAOH - БРОНЗОВЫЙ ШЕДЕВР | ОБЗОР.
▶ 311.0K👍 6.5K💬 889
Шам(26.8K subs)
Oct 29, 2023
 1:00
Total War: Pharaoh's Kill Animations Are...AWESOME?
▶ 263.2K👍 8.8K💬 278
HappyCompyTW(15.8K subs)
May 24, 2024
 11:36
Total War: Pharaoh Review
▶ 248.7K👍 2.3K💬 413
IGN(19.8M subs)
Oct 10, 2023
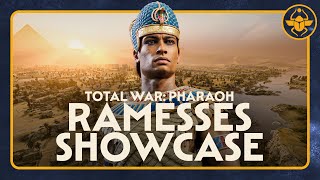 16:42
Total War: PHARAOH - Ramesses Gameplay Showcase
▶ 211.6K👍 5.8K💬 1.3K
Total War(578.0K subs)
Jun 13, 2023
 52:52
THE BRUTAL TRUTH - TOTAL WAR PHARAOH REVIEW AND GUIDE
▶ 162.0K👍 3.7K💬 887
Andy's Take(75.2K subs)
Oct 10, 2023
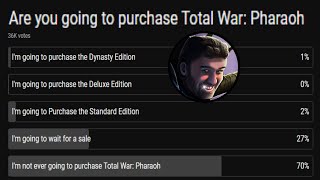 9:59
Total War: Pharaoh is Doomed
▶ 160.5K👍 7.2K💬 1.6K
LegendofTotalWar(559.0K subs)
Sep 19, 2023
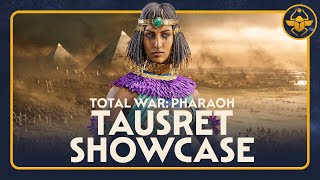 16:46
Total War: PHARAOH - Tausret Gameplay Showcase
▶ 159.2K👍 4.3K💬 928
Total War(578.0K subs)
Jun 29, 2023
 16:09
Massenschlachten zwischen Sandsturm und Sintflut! - Total War: Pharaoh im Test / Review
▶ 152.4K👍 2.7K💬 325
GameStar(1.6M subs)
Oct 10, 2023
 14:21
Total War: PHARAOH - Egyptian Faction Deep Dive
▶ 142.2K👍 4.3K💬 703
Total War(578.0K subs)
Jul 6, 2023
 1:55
Total War PHARAOH - Launch Trailer
▶ 141.2K👍 2.0K💬 849
Total War(578.0K subs)
Oct 11, 2023
 1:03
Total War: PHARAOH - Dynasties Overview
▶ 132.0K👍 4.5K💬 689
Total War(578.0K subs)
Jul 9, 2024
 36:25
I React To Total War: Pharaoh...
▶ 123.8K👍 6.2K💬 1.2K
Pixelated Apollo(998.0K subs)
Jun 1, 2023
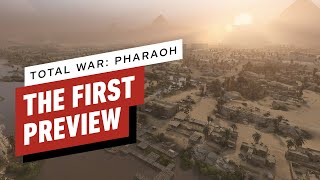 7:11
Total War Pharaoh: The First Hands-On Preview
▶ 118.6K👍 1.8K💬 260
IGN(19.8M subs)
Jun 1, 2023
Creators also play these games
 $39.99
Total War: THREE KINGDOMS
Very Positive96.1K reviews
19 shared creators
 $8.99
Total War: ATTILA
Very Positive39.3K reviews
20 shared creators
 $19.99
A Total War Saga: THRONES OF BRITANNIA
Mostly Positive15.3K reviews
16 shared creators
 $14.99
Total War: WARHAMMER
Mostly Positive53.7K reviews
12 shared creators
 $29.99
Total War: ROME REMASTERED
Mostly Positive14.4K reviews
19 shared creators
 $29.99
The Rogue Prince of Persia
Very Positive3.2K reviews
3 shared creators
 $59.99
Total War: WARHAMMER II
Very Positive124.2K reviews
5 shared creators
 $14.99
Mandate Of Heaven
Very Positive7.1K reviews
7 shared creators
 $29.99
Master of Command
Very Positive4.4K reviews
6 shared creators
 $14.99
Verdun
Very Positive39.5K reviews
3 shared creators
Is Total War: PHARAOH Worth It? Player Reviews AnalyzedAI-powered summary, highlights, dimensional insights and SWOT analysis
"The player feedback reveals that while many players appreciate the game's engaging mechanics, immersive gameplay, and visual effects that enhance their overall experience, they are also frustrated by significant performance issues leading to refunds, critical stability problems causing crashes and desync in multiplayer, as well as a lack of sufficient unit variation and diverse endings that limit replayability and depth; additionally, there is mixed sentiment surrounding improvements made through free updates and the historical context added to the storyline, but disappointment exists in the game's shift towards a less appealing art style, the repetitiveness of voice lines, and mixed reviews on voice acting quality, highlighting the necessity for further enhancements to maintain player satisfaction and address their concerns."
Unlock AI-powered review analysis to discover player sentiment, strengths, weaknesses, multi-dimensional insights and market positioning for this game.
Upgrade to Pro →Total War: PHARAOH Steam Rank HistoryGame ranking by indicators and genres among all Steam games
Unlock ranking data to see how this game performs across all Steam titles by key indicators and genres.
Upgrade to Starter →Games Like Total War: PHARAOHBased on similar characteristics and audience overlap
Total: 84
1/17
| Name | User Rating | Review Count | Original Price | Gross Revenue | Units Sold | Franchise |
|---|---|---|---|---|---|---|
| 82% | 20.03k | $39.99 | $8.70m | 866.15k | Warhammer | |
| 82% | 96.07k | $39.99 | $45.10m | 8.26m | Total War | |
| 87% | 155.63k | $49.99 | $180.96m | 15.35m | Crusader Kings | |
| 84% | 88.53k | $1.99 | $33.78m | 5.48m | Battlefield, EA Play | |
| 86% | 244.46k | $39.99 | $84.57m | 17.21m | Battlefield, EA Play |


What Else Do Total War: PHARAOH Players Also Play?Based on real player follow and wishlist data
By Followers
Total: 10
1/2
| Name | Player Overlap | User Rating | Review Count | Original Price | Gross Revenue | Units Sold | Franchise |
|---|---|---|---|---|---|---|---|
| 19% | 59% | 185.48k | $49.99 | $1.12b | 24.20m | Starfield | |
| 15% | 87% | 311.37k | $49.99 | $205.93m | 6.96m | Mount u0026 Blade | |
| 16% | 96% | 891.02k | $59.99 | $3.70b | 105.49m | Baldur's Gate | |
| 15% | 69% | 160.27k | $59.99 | $394.23m | 17.66m | Total War, Warhammer | |
| 13% | 87% | 1.05m | $59.99 | $1.92b | 54.88m | -- |


* Based on players who follow this game, showing the games they also follow most. Higher player overlap means the two games share a more similar audience.
By Wishlists
Total: 10
1/2
| Name | Player Overlap | User Rating | Review Count | Original Price | Gross Revenue | Units Sold | Franchise |
|---|---|---|---|---|---|---|---|
| 20% | 84% | 96.27k | $39.99 | $491.96m | 24.58m | -- | |
| 19% | 59% | 185.48k | $49.99 | $1.12b | 24.20m | Starfield | |
| 14% | 55% | 99.70k | $49.99 | $437.57m | 13.12m | Cities: Skylines | |
| 15% | 58% | 43.18k | $59.99 | $182.02m | 4.56m | Company of Heroes | |
| 16% | 96% | 891.02k | $59.99 | $3.70b | 105.49m | Baldur's Gate |


* Based on players who have wishlisted this game, showing the games they also wishlist most. Higher player overlap means the two games share a more similar audience.