Released
RIDE 5
RIDE 5 Stats & OverviewStore page details, rankings, sales estimates, and platform support

Rev up your engine and get ready to hit the track with RIDE 5. An adrenaline-filled gaming experience that is so authentic it will make you feel like you're truly racing at break-neck speed.
Platforms

Product Type
Game
Franchise
RIDE
Recent Reviews
Very Positive (20)
All Reviews
Very Positive (3.58k)
User Rating
81.75%
Current Average Daily CCU
63
Wishlists
189.62k
Followers
18.57k
Top Sellers-- (ATH:140)
Recently, it has not been on the daily ranking list.
Best: 140 on 11-10-2023, daily ranking
Best: 140 on 11-10-2023, daily ranking
Most Played1209 (ATH:324)
Ranked 1209 on 20-11-2026.
Best: 324 on 06-06-2025, daily ranking
Best: 324 on 06-06-2025, daily ranking
Genres
Tags
Original Price
$59.99
Current Price
$49.99 (-16%)
Gross Revenue
$3.21m
Units Sold
100.88k
Player Modes
Controller Support
Content Rating

Achievements





RIDE 5 Purchase Options & Price ComparisonBest Purchase Option: RIDE 5
 United States
$49.99
 Austria
49,99€
 Australia
A$ 74.95
 Belgium
49,99€
 Brazil
R$209,00
 Canada
C$ 66.99
 Switzerland
CHF 49.90
 China
¥248.00
 Czechia
49,99€
 Germany
49,99€
 Denmark
49,99€
 Spain
49,99€
 Finland
49,99€
 France
49,99€
 United Kingdom
£44.99
 Hong Kong
HK$ 398.00
 Italy
49,99€
 Japan
¥6,710
 South Korea
₩ 54,800
 Netherlands
49,99€
 Norway
549,00 kr
 New Zealand
NZ$ 84.95
 Poland
219,00 zł
 Sweden
49,99€
 Singapore
S$69.90
 Thailand
฿1,499.00
 Türkiye
$49.99
 Taiwan
NT$ 1,490.00
| Country | Original | Final | Discount | Ends in |
|---|---|---|---|---|
| United States | $49.99 | - | - | - |
| Austria | 49,99€ | - | - | - |
| Australia | A$ 74.95 | - | - | - |
| Belgium | 49,99€ | - | - | - |
| Brazil | R$209,00 | - | - | - |
| Canada | C$ 66.99 | - | - | - |
| Switzerland | CHF 49.90 | - | - | - |
| China | ¥248.00 | - | - | - |
| Czechia | 49,99€ | - | - | - |
| Germany | 49,99€ | - | - | - |
| Denmark | 49,99€ | - | - | - |
| Spain | 49,99€ | - | - | - |
| Finland | 49,99€ | - | - | - |
| France | 49,99€ | - | - | - |
| United Kingdom | £44.99 | - | - | - |
| Hong Kong | HK$ 398.00 | - | - | - |
| Italy | 49,99€ | - | - | - |
| Japan | ¥6,710 | - | - | - |
| South Korea | ₩ 54,800 | - | - | - |
| Netherlands | 49,99€ | - | - | - |
| Norway | 549,00 kr | - | - | - |
| New Zealand | NZ$ 84.95 | - | - | - |
| Poland | 219,00 zł | - | - | - |
| Sweden | 49,99€ | - | - | - |
| Singapore | S$69.90 | - | - | - |
| Thailand | ฿1,499.00 | - | - | - |
| Türkiye | $49.99 | - | - | - |
| Taiwan | NT$ 1,490.00 | - | - | - |
RIDE 5 Revenue & Sales EstimatesRegional sales, revenue, reviews and player trends over time
Period
Regional Analysis
Unlock game performance data including regional sales, revenue trends and player metrics over time.Upgrade to Starter →
Sales and Ratings
Unlock game performance data including regional sales, revenue trends and player metrics over time.Upgrade to Starter →
Regional Trends
Revenue & Units require Starter plan. Upgrade to Starter →Unit
Tiled Charts
Metrics
Review Count▼
Loading Regional Trends...
Regional Game Metrics
Revenue & Units require Starter plan. Upgrade to Starter →Total: 0
RIDE 5 DLC Revenue & SalesSales, pricing, review and player metrics for each DLC
Unlock DLC performance data including sales, pricing, review distribution and player metrics for each DLC.
Upgrade to Pro →RIDE 5 Videos & TrailersVideo coverage and creator analysis from YouTube
📹 1009 videos👤 264 creators👁 55.9M views
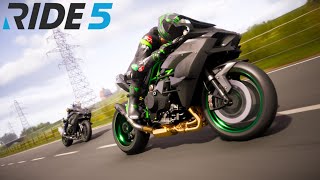 13:31
RIDE 5 | KAWASAKI NINJA H2R 2021 - Northwest 200 GP circuit Race gameplay!!!
▶ 10.9M👍 315.6K💬 388
JetRockz Gaming(74.0K subs)
Mar 29, 2024
 8:24
2021 Kawasaki Ninja ZX-10RR Freeroam POV - Ride 5 Gameplay
▶ 10.7M👍 79.8K💬 99
TheOnlyDriver(19.8K subs)
Aug 31, 2023
 5:23
RIDE 5 | MV AGUSTA F4 EM 2019 Conquers Vallelunga – Italian Precision Unleashed!
▶ 8.0M👍 16💬 0
JetRockz Gaming(74.0K subs)
Sep 13, 2025
 5:47
RIDE 5 | KTM 1290 SUPER DUKE R Takes on Stelvio – The Beast Meets the Mountain!
▶ 4.5M👍 13💬 0
JetRockz Gaming(74.0K subs)
Sep 9, 2025
 9:48
Kawasaki Ninja H2R Freeroam Sunrise POV - Ride 5 Gameplay
▶ 3.6M👍 129.3K💬 554
TheOnlyDriver(19.8K subs)
Aug 25, 2023
 13:29
RIDE 5 | Customize Full Carbon BMW S1000RR SC Project Gameplay [4K PS5 Pro]
▶ 1.3M👍 13.1K💬 208
deky777(24.2K subs)
Jan 4, 2025
 6:01
POV : You Got Your Dream Bike | KAWASAKI Z900 | RIDE 5 [4K 60 FPS HDR]
▶ 840.5K👍 9.3K💬 652
GASOLINE ⛽(5.2K subs)
Jul 4, 2024
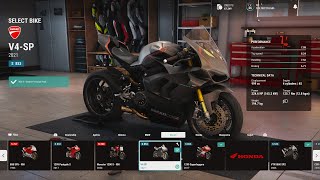 6:58
RIDE 5 | Customize Fastest Ducati V4 SP Gameplay [4K 60fps HDR]
▶ 703.6K👍 8.4K💬 273
deky777(24.2K subs)
May 5, 2024
 0:16
RIDE 5 KAWASAKI NINJA H2R BIKE RACING GAMEPLAY #ride5 #kawasaki#h2r #ninjah2r #ps5
▶ 619.7K👍 4.2K💬 33
🤡RAJAZ900EDITORKING007💞
May 4, 2026
 5:25
RIDE 5 | Honda RVF750 RC45 1994 Conquers Almeria – Legendary 90s Superbike!
▶ 474.7K👍 7💬 0
JetRockz Gaming(74.0K subs)
Sep 2, 2025
 26:41
EL JUEGO DE MOTOS CON MEJORES GRÁFICOS Y REALISTA 🤯 RIDE 5
▶ 428.4K👍 8.0K💬 154
polman(1.5M subs)
Aug 26, 2023
 15:48
RIDE 5 - Part 1 - The Beginning
▶ 396.1K👍 6.3K💬 295
TmarTn2(5.6M subs)
Aug 21, 2023
 17:12
RIDE 5 - O INÍCIO DE GAMEPLAY (DUBLADO PT-BR) NOVO JOGO DE CORRIDA DE MOTOS ULTRA REALISTA!
▶ 359.4K👍 9.0K💬 283
IGÃO PLAY(641.0K subs)
Aug 25, 2023
 5:32
RIDE 5 | MV AGUSTA BRUTALE 800RR 2021 Attacks Magny-Cours with Sheer Fury!
▶ 343.7K👍 408💬 1
JetRockz Gaming(74.0K subs)
Jul 30, 2025
 15:37
RIDE 5 | Customize Brutal Yamaha R1M Valentino Rossi VR46 Gameplay [4K PS5 Pro]
▶ 319.3K👍 3.1K💬 63
deky777(24.2K subs)
May 9, 2025
 13:42
RIDE 5 | Customize Fastest R1M Full Carbon Yamaha Gameplay [4K PS5 Pro]
▶ 304.5K👍 4.3K💬 76
deky777(24.2K subs)
Dec 30, 2024
 0:26
RIDE 5 ktm 1290 BIKES RACING GAME PLAY #ktm1290superduke
▶ 271.2K👍 3.8K💬 5
TurboGamer(15.4K subs)
May 28, 2026
 8:57
Yamaha YZF-R1M Freeroam POV - Ride 5 Gameplay
▶ 267.4K👍 2.3K💬 216
TheOnlyDriver(19.8K subs)
Sep 18, 2023
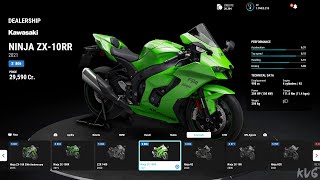 10:29
RIDE 5 - All Bikes | List (PS5 UHD) [4K60FPS]
▶ 244.8K👍 2.4K💬 157
Throneful(2.5M subs)
Aug 21, 2023
 6:19
Ride 5 | SUZUKI GSX R 1000 2007 - Mugello Grand Prix Circuit Race gameplay!!!
▶ 243.7K👍 71💬 4
JetRockz Gaming(74.0K subs)
Nov 22, 2023
Creators also play these games
 $29.99
MotoGP™22
Very Positive1.7K reviews
27 shared creators
 $39.99
Assetto Corsa EVO
Mixed23.1K reviews
14 shared creators
 $52.49
Forza Horizon 6
Very Positive107.6K reviews
14 shared creators
 $39.99
Project Motor Racing
Mixed2.7K reviews
10 shared creators
 $29.99
Sledders
Overwhelming Positive5.1K reviews
3 shared creators
 $54.99
F1® Manager 2023
Very Positive3.3K reviews
5 shared creators
 $44.99
LOLLIPOP CHAINSAW RePOP
Very Positive3.2K reviews
3 shared creators
 $59.99
WARRIORS OROCHI 4
Very Positive5.8K reviews
3 shared creators
 $19.99
Prison Simulator
Very Positive2.7K reviews
5 shared creators
 $49.99
EA SPORTS™ WRC
Mixed12.1K reviews
13 shared creators
Is RIDE 5 Worth It? Player Reviews AnalyzedAI-powered summary, highlights, dimensional insights and SWOT analysis
"The game's smooth performance with minimal load times, highly realistic motorcycle racing experience featuring excellent physics and graphics, and user-friendly gameplay that revitalizes fun for beginners are prominent strengths; however, players have raised concerns about persistent bugs and crashes that disrupt play, a lack of significant innovation since previous installments resulting in some dissatisfaction with the sequel's quality, and disappointments regarding multiplayer engagement and dull career progression, leading to mixed feelings about the overall experience."
Unlock AI-powered review analysis to discover player sentiment, strengths, weaknesses, multi-dimensional insights and market positioning for this game.
Upgrade to Pro →RIDE 5 Steam Rank HistoryGame ranking by indicators and genres among all Steam games
Unlock ranking data to see how this game performs across all Steam titles by key indicators and genres.
Upgrade to Starter →Games Like RIDE 5Based on similar characteristics and audience overlap
Total: 130
1/26
| Name | User Rating | Review Count | Original Price | Gross Revenue | Units Sold | Franchise |
|---|---|---|---|---|---|---|
| 79% | 1.05k | $29.99 | $1.25m | 76.52k | MotoGP™ | |
| 58% | 117.49k | $69.99 | $392.48m | 17.41m | EA Sports | |
| 33% | 45.64k | $59.99 | $202.65m | 9.38m | NBA 2K | |
| 63% | 53.75k | -- | $110.11m | 11.02m | NBA 2K | |
| 82% | 35.63k | $39.99 | $54.16m | 6.76m | -- |


What Else Do RIDE 5 Players Also Play?Based on real player follow and wishlist data
By Followers
Total: 10
1/2
| Name | Player Overlap | User Rating | Review Count | Original Price | Gross Revenue | Units Sold | Franchise |
|---|---|---|---|---|---|---|---|
| 13% | 87% | 1.05m | $59.99 | $1.92b | 54.88m | -- | |
| 15% | 83% | 12.96k | $39.99 | $14.65m | 1.31m | RIDE | |
| 13% | 89% | 299.54k | $59.99 | $768.82m | 31.84m | Forza | |
| 12% | 59% | 185.48k | $49.99 | $1.12b | 24.20m | Starfield | |
| 9% | 88% | 2.18m | -- | $929.44m | 71.58m | Grand Theft Auto |


* Based on players who follow this game, showing the games they also follow most. Higher player overlap means the two games share a more similar audience.
By Wishlists
Total: 10
1/2
| Name | Player Overlap | User Rating | Review Count | Original Price | Gross Revenue | Units Sold | Franchise |
|---|---|---|---|---|---|---|---|
| 13% | 89% | 299.54k | $59.99 | $768.82m | 31.84m | Forza | |
| 9% | 47% | 74.58k | $29.99 | $265.57m | 8.29m | PAYDAY | |
| 10% | 88% | 343.32k | $29.99 | $386.28m | 20.07m | -- | |
| 12% | 59% | 185.48k | $49.99 | $1.12b | 24.20m | Starfield | |
| 10% | 78% | 373.99k | $24.99 | $499.26m | 17.13m | -- |


* Based on players who have wishlisted this game, showing the games they also wishlist most. Higher player overlap means the two games share a more similar audience.