Released
Star Trek: Infinite
Star Trek: Infinite Stats & OverviewStore page details, rankings, sales estimates, and platform support

Star Trek: Infinite is a grand strategy experience that lets you play your own Star Trek story as the leader of one of four major factions in the galaxy. Follow the specially crafted story or blaze your own trail in the first Star Trek grand strategy game.
Platforms

Product Type
Game
Franchise
Star Trek
Recent Reviews
4
All Reviews
Mixed (3.12k)
User Rating
42.77%
Current Average Daily CCU
25
Wishlists
92.80k
Followers
22.78k
Top Sellers-- (ATH:21)
Recently, it has not been on the daily ranking list.
Best: 21 on 17-10-2023, daily ranking
Best: 21 on 17-10-2023, daily ranking
Most Played-- (ATH:170)
Recently, it has not been on the daily ranking list.
Best: 170 on 13-10-2023, daily ranking
Best: 170 on 13-10-2023, daily ranking
Tags
Original Price
$29.99
Current Price
$29.99
Gross Revenue
$1.99m
Units Sold
76.46k


Star Trek: Infinite Purchase Options & Price ComparisonBest Purchase Option: Star Trek: Infinite
 United States
$29.99
 Austria
29,99€
 Australia
A$ 42.95
 Belgium
29,99€
 Brazil
R$124,99
 Canada
C$ 39.99
 Switzerland
CHF 33.49
 China
¥148.00
 Czechia
29,99€
 Germany
29,99€
 Denmark
29,99€
 Spain
29,99€
 Finland
29,99€
 France
29,99€
 United Kingdom
£26.99
 Hong Kong
HK$ 218.00
 Italy
29,99€
 Japan
¥3,990
 South Korea
₩ 33,000
 Netherlands
29,99€
 Norway
335,00 kr
 New Zealand
NZ$ 47.99
 Poland
138,99 zł
 Russia
1599 руб
 Sweden
29,99€
 Singapore
S$37.00
 Thailand
฿799.00
 Türkiye
$17.99
 Taiwan
NT$ 858.00
| Country | Original | Final | Discount | Ends in |
|---|---|---|---|---|
| United States | $29.99 | - | - | - |
| Austria | 29,99€ | - | - | - |
| Australia | A$ 42.95 | - | - | - |
| Belgium | 29,99€ | - | - | - |
| Brazil | R$124,99 | - | - | - |
| Canada | C$ 39.99 | - | - | - |
| Switzerland | CHF 33.49 | - | - | - |
| China | ¥148.00 | - | - | - |
| Czechia | 29,99€ | - | - | - |
| Germany | 29,99€ | - | - | - |
| Denmark | 29,99€ | - | - | - |
| Spain | 29,99€ | - | - | - |
| Finland | 29,99€ | - | - | - |
| France | 29,99€ | - | - | - |
| United Kingdom | £26.99 | - | - | - |
| Hong Kong | HK$ 218.00 | - | - | - |
| Italy | 29,99€ | - | - | - |
| Japan | ¥3,990 | - | - | - |
| South Korea | ₩ 33,000 | - | - | - |
| Netherlands | 29,99€ | - | - | - |
| Norway | 335,00 kr | - | - | - |
| New Zealand | NZ$ 47.99 | - | - | - |
| Poland | 138,99 zł | - | - | - |
| Russia | 1599 руб | - | - | - |
| Sweden | 29,99€ | - | - | - |
| Singapore | S$37.00 | - | - | - |
| Thailand | ฿799.00 | - | - | - |
| Türkiye | $17.99 | - | - | - |
| Taiwan | NT$ 858.00 | - | - | - |
Star Trek: Infinite Revenue & Sales EstimatesRegional sales, revenue, reviews and player trends over time
Period
Regional Analysis
Unlock game performance data including regional sales, revenue trends and player metrics over time.Upgrade to Starter →
Sales and Ratings
Unlock game performance data including regional sales, revenue trends and player metrics over time.Upgrade to Starter →
Regional Trends
Revenue & Units require Starter plan. Upgrade to Starter →Unit
Tiled Charts
Metrics
Review Count▼
Loading Regional Trends...
Regional Game Metrics
Revenue & Units require Starter plan. Upgrade to Starter →Total: 0
Star Trek: Infinite DLC Revenue & SalesSales, pricing, review and player metrics for each DLC
Unlock DLC performance data including sales, pricing, review distribution and player metrics for each DLC.
Upgrade to Pro →Star Trek: Infinite Videos & TrailersVideo coverage and creator analysis from YouTube
📹 721 videos👤 224 creators👁 3.1M views
 0:45
Star Trek: Infinite - Teaser Trailer
▶ 477.0K👍 8.0K💬 1.1K
Paradox Interactive(389.0K subs)
Jun 8, 2023
 1:12
Star Trek: Infinite - Gameplay Reveal Trailer
▶ 166.3K👍 3.7K💬 841
Paradox Interactive(389.0K subs)
Jun 16, 2023
 1:26
Star Trek Infinite Space - Galaxy at War | OFFICIAL trailer (2011)
▶ 163.5K👍 385💬 175
moviemaniacsDE(2.0M subs)
Oct 27, 2010
 8:13
Star Trek: Infinite Review
▶ 143.0K👍 2.0K💬 218
IGN(19.8M subs)
Oct 12, 2023
 5:04
Star Trek: Infinite | Your First Day
▶ 140.3K👍 3.5K💬 523
Paradox Interactive(389.0K subs)
Oct 10, 2023
 18:28
Should You Buy Star Trek Infinite?
▶ 125.5K👍 4.1K💬 836
Montu Plays(195.0K subs)
Oct 12, 2023
 58:07
#1: Energie! ✦ Let's Play Star Trek Infinite ✦ Die Föderation (Gameplay / German)
▶ 94.3K👍 2.0K💬 182
Steinwallen – Games & History(117.0K subs)
Oct 12, 2023
 5:04
Star Trek: Infinite - Official 'Your First Day' Trailer
▶ 88.0K👍 736💬 54
IGN(19.8M subs)
Oct 10, 2023
 37:28
Star Trek Infinite for Beginners - The Basics
▶ 84.4K👍 1.8K💬 324
ASpec(196.0K subs)
Oct 12, 2023
 1:07
Star Trek: Infinite - Game Features and Pre-Purchase Bonus
▶ 77.8K👍 1.4K💬 348
Paradox Interactive(389.0K subs)
Sep 7, 2023
 2:22:55
Star Trek Infinite - Early Access
▶ 71.3K👍 1.5K💬 246
Montu Plays(195.0K subs)
Oct 12, 2023
 9:34
Gamescom Coverage : WTF is Star Trek : Infinite Space?
▶ 62.7K👍 1.7K💬 220
TotalBiscuit(1.9M subs)
Aug 24, 2011
 1:00
Star Trek: Infinite | Out Now
▶ 57.6K👍 832💬 105
Paradox Interactive(389.0K subs)
Oct 12, 2023
 10:30
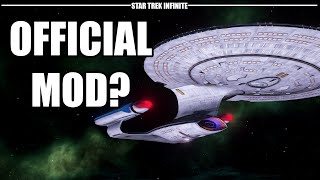
Star Trek Infinite is a Total Conversion of Stellaris
▶ 48.6K👍 1.7K💬 285
ASpec(196.0K subs)
Jun 17, 2023
 5:14
Star Trek: Infinite Space Gameplay
▶ 47.6K👍 109💬 137
BlisteredGaming(4.4K subs)
Mar 8, 2011
 8:03
"Star Trek: Infinite" -- An Official Stellaris "Mod"?
▶ 39.9K👍 1.6K💬 321
quill18(675.0K subs)
Jun 16, 2023
 4:58
Star Trek: Infinite Preview: Spreadsheets, the Final Frontier
▶ 37.5K👍 965💬 104
IGN(19.8M subs)
Sep 13, 2023
 31:13
Beginnings - Star Trek: Infinite - Federation Playthrough - Episode 1
▶ 33.4K👍 521💬 62
Phillerb(1.1K subs)
Oct 13, 2023
 1:10
Star Trek - Infinite Space: Battle Scenes
▶ 27.7K👍 108💬 28
StarTrekIS(9.9K subs)
Jul 21, 2011
 35:57
Stellaris meets Star Trek! STAR TREK INFINITE (01) | Preview Let's Play [Deutsch] [Werbung|ad]
▶ 26.9K👍 584💬 43
Writing Bull(75.8K subs)
Oct 12, 2023
Creators also play these games
 $49.99
Stellaris
Very Positive208.2K reviews
19 shared creators
 $19.99
STAR WARS™ Empire at War - Gold Pack
Overwhelming Positive44.8K reviews
2 shared creators
 $34.99
Star Trek: Voyager - Across the Unknown
Mostly Positive4.9K reviews
15 shared creators
 $8.74
Republic of Pirates
Mostly Positive562 reviews
7 shared creators
 $24.99
Imagine Earth
Mostly Positive999 reviews
6 shared creators
 $34.99
Pioneers of Pagonia
Very Positive5.7K reviews
13 shared creators
 $29.99
Industries of Titan
Mixed1.7K reviews
3 shared creators
 $19.99
Age of Wonders 4
Very Positive24.6K reviews
11 shared creators
 $14.99
Realpolitiks
Mixed1.3K reviews
3 shared creators
 $19.99
The Last Starship
Mostly Positive1.8K reviews
8 shared creators
Is Star Trek: Infinite Worth It? Player Reviews AnalyzedAI-powered summary, highlights, dimensional insights and SWOT analysis
"The feedback reveals that players appreciate the active developer engagement in resolving minor issues, the game's overall concept and design, and the visual detail and aesthetics, while expressing concerns over the rushed overall performance, significant stability issues including launch failures, and the severe lack of content which restricts replayability, alongside a desire for improved animation quality and character development; although some enjoy the variety of endings, many urge the implementation of more dynamic events, challenge modes, and consistent updates to enhance gameplay depth and multiplayer interactions, indicating a need for developers to rebuild trust with the community amidst mixed opinions on the balance between competitive and casual play, as well as discontent regarding the game's pricing strategy, which many deem overpriced relative to the current content combined with mixed feelings about the storyline's complexity and the game's innovation level needing further development and completion."
Unlock AI-powered review analysis to discover player sentiment, strengths, weaknesses, multi-dimensional insights and market positioning for this game.
Upgrade to Pro →Star Trek: Infinite Steam Rank HistoryGame ranking by indicators and genres among all Steam games
Unlock ranking data to see how this game performs across all Steam titles by key indicators and genres.
Upgrade to Starter →Games Like Star Trek: InfiniteBased on similar characteristics and audience overlap
Total: 66
1/14
| Name | User Rating | Review Count | Original Price | Gross Revenue | Units Sold | Franchise |
|---|---|---|---|---|---|---|
| 75% | 760 | $24.99 | $290.55k | 25.15k | -- | |
| 78% | 31.68k | $49.99 | $28.06m | 1.75m | X | |
| 46% | 445 | $4.99 | $6.80k | 3.79k | -- | |
| 97% | 93.68k | $19.99 | $211.54m | 16.64m | -- | |
| 68% | 404 | $19.99 | $44.92k | 4.88k | Fulqrum |


What Else Do Star Trek: Infinite Players Also Play?Based on real player follow and wishlist data
By Followers
Total: 10
1/2
| Name | Player Overlap | User Rating | Review Count | Original Price | Gross Revenue | Units Sold | Franchise |
|---|---|---|---|---|---|---|---|
| 18% | 59% | 185.48k | $49.99 | $1.12b | 24.20m | Starfield | |
| 16% | 96% | 891.02k | $59.99 | $3.70b | 105.49m | Baldur's Gate | |
| 11% | 87% | 1.05m | $59.99 | $1.92b | 54.88m | -- | |
| 10% | 84% | 208.19k | $49.99 | $64.21m | 7.09m | Stellaris | |
| 14% | 79% | 13.99k | $34.99 | $12.04m | 924.00k | -- |


* Based on players who follow this game, showing the games they also follow most. Higher player overlap means the two games share a more similar audience.
By Wishlists
Total: 10
1/2
| Name | Player Overlap | User Rating | Review Count | Original Price | Gross Revenue | Units Sold | Franchise |
|---|---|---|---|---|---|---|---|
| 15% | 84% | 96.27k | $39.99 | $491.96m | 24.58m | -- | |
| 18% | 59% | 185.48k | $49.99 | $1.12b | 24.20m | Starfield | |
| 17% | 0% | 0 | -- | 0 | 0 | -- | |
| 14% | 55% | 99.70k | $49.99 | $437.57m | 13.12m | Cities: Skylines | |
| 13% | 39% | 9.01k | $59.99 | $32.08m | 725.26k | Homeworld |


* Based on players who have wishlisted this game, showing the games they also wishlist most. Higher player overlap means the two games share a more similar audience.