Released
Regiments
Regiments Stats & OverviewStore page details, rankings, sales estimates, and platform support

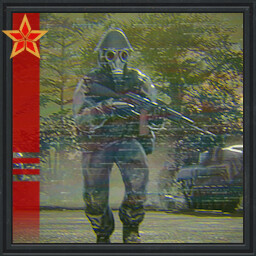
Regiments is a Real-Time Tactics game set in Germany 1989. The Cold War has gone hot, and the inferno is raging.
Lead your Regiment through the fires of conflict and the fog of war. Break through the lines, call in artillery, maneuver, feign retreats, stage defenses, counter-attack. Do not relent.
Platforms

Product Type
Game
Franchise
Regiments
Recent Reviews
Very Positive (15)
All Reviews
Very Positive (2.95k)
User Rating
87.37%
Current Average Daily CCU
14
Wishlists
212.96k
Followers
30.69k
Top Sellers-- (ATH:22)
Recently, it has not been on the daily ranking list.
Best: 22 on 27-08-2022, daily ranking
Best: 22 on 27-08-2022, daily ranking
Most Played-- (ATH:42)
Recently, it has not been on the daily ranking list.
Best: 42 on 16-08-2022, daily ranking
Best: 42 on 16-08-2022, daily ranking
Original Price
$29.98
Current Price
$29.99
Gross Revenue
$1.08m
Units Sold
54.13k




Regiments Purchase Options & Price ComparisonBest Purchase Option: Regiments
 United States
$29.99
 Austria
24,99€
 Australia
A$ 41.95
 Belgium
24,99€
 Brazil
R$57,99
 Canada
C$ 33.99
 Switzerland
CHF 30.00
 China
¥90.00
 Czechia
24,99€
 Germany
24,99€
 Denmark
24,99€
 Spain
24,99€
 Finland
24,99€
 France
24,99€
 United Kingdom
£23.79
 Hong Kong
HK$ 129.00
 Italy
24,99€
 Japan
¥3,090
 South Korea
₩ 24,500
 Netherlands
24,99€
 Norway
207,00 kr
 New Zealand
NZ$ 36.99
 Poland
56,49 zł
 Russia
515 руб
 Sweden
24,99€
 Singapore
S$26.00
 Thailand
฿379.00
 Türkiye
$14.99
 Taiwan
NT$ 438.00
| Country | Original | Final | Discount | Ends in |
|---|---|---|---|---|
| United States | $29.99 | - | - | - |
| Austria | 24,99€ | - | - | - |
| Australia | A$ 41.95 | - | - | - |
| Belgium | 24,99€ | - | - | - |
| Brazil | R$57,99 | - | - | - |
| Canada | C$ 33.99 | - | - | - |
| Switzerland | CHF 30.00 | - | - | - |
| China | ¥90.00 | - | - | - |
| Czechia | 24,99€ | - | - | - |
| Germany | 24,99€ | - | - | - |
| Denmark | 24,99€ | - | - | - |
| Spain | 24,99€ | - | - | - |
| Finland | 24,99€ | - | - | - |
| France | 24,99€ | - | - | - |
| United Kingdom | £23.79 | - | - | - |
| Hong Kong | HK$ 129.00 | - | - | - |
| Italy | 24,99€ | - | - | - |
| Japan | ¥3,090 | - | - | - |
| South Korea | ₩ 24,500 | - | - | - |
| Netherlands | 24,99€ | - | - | - |
| Norway | 207,00 kr | - | - | - |
| New Zealand | NZ$ 36.99 | - | - | - |
| Poland | 56,49 zł | - | - | - |
| Russia | 515 руб | - | - | - |
| Sweden | 24,99€ | - | - | - |
| Singapore | S$26.00 | - | - | - |
| Thailand | ฿379.00 | - | - | - |
| Türkiye | $14.99 | - | - | - |
| Taiwan | NT$ 438.00 | - | - | - |
Regiments Revenue & Sales EstimatesRegional sales, revenue, reviews and player trends over time
Period
Regional Analysis
Unlock game performance data including regional sales, revenue trends and player metrics over time.Upgrade to Starter →
Sales and Ratings
Unlock game performance data including regional sales, revenue trends and player metrics over time.Upgrade to Starter →
Regional Trends
Revenue & Units require Starter plan. Upgrade to Starter →Unit
Tiled Charts
Metrics
Review Count▼
Loading Regional Trends...
Regional Game Metrics
Revenue & Units require Starter plan. Upgrade to Starter →Total: 0
Regiments DLC Revenue & SalesSales, pricing, review and player metrics for each DLC
Unlock DLC performance data including sales, pricing, review distribution and player metrics for each DLC.
Upgrade to Pro →Regiments Videos & TrailersVideo coverage and creator analysis from YouTube
📹 728 videos👤 224 creators👁 11.2M views
 23:31
Gurkha Regiments live like Kings - Col Rajeev Bharwan | Mumma Sir | Monks & Warriors
▶ 1.1M👍 25.1K💬 1.0K
Monks & Warriors Clips (143.0K subs)
Feb 18, 2025
 19:35
INTENSE U.S. LINE BATTLE - Regiments of American Revolution Mod Gameplay
▶ 1.1M👍 12.3K💬 1.3K
Pixelated Apollo(998.0K subs)
Aug 14, 2016
 2:08
Ranger Regiment soldier shows off UK military's new KS-1 assault rifle
▶ 897.8K👍 10.6K💬 2.1K
BFBS Forces News(1.0M subs)
Sep 19, 2023
 16:25
Regiments of Indian Army | Motto and War Cry - Part 1
▶ 758.0K👍 23.3K💬 1.2K
SSBCrackExams(1.3M subs)
May 10, 2020
 1:50:11
Regiments of the French Foreign Legion (documentary)
▶ 603.1K👍 1.8K💬 19
MAHARBAL5022(27.9K subs)
Jul 1, 2014
 24:54
ХОЛОДНАЯ ВОЙНА ( Regiments )
▶ 457.7K👍 13.5K💬 420
perpetuumworld(4.3M subs)
Jul 25, 2023
 25:54
Cold War goes Spicy Chemically Hot | Regiments
▶ 279.9K👍 11.3K💬 329
Rimmy Downunder(584.0K subs)
Sep 27, 2022
 3:13
Life in the Royal Regiment of Fusiliers - Army Regiments
▶ 232.6K👍 1.9K💬 0
Army Jobs(85.5K subs)
May 7, 2014
 15:31
Ein Krieg in Deutschland, den es zum Glück nie gab! - Regiments im Test / Review
▶ 205.3K👍 3.8K💬 117
GameStar(1.6M subs)
Aug 26, 2022
 3:15
The Colonels Review - 'Die Regimentskinder'
▶ 203.5K👍 637💬 166
LegoMiltaria(569 subs)
Jun 10, 2009
 10:48
Influences for ICONIC Imperial Guard Regiments PART 1 | Warhammer 40k Lore
▶ 202.9K👍 13.5K💬 606
KrakDuk(312.0K subs)
May 5, 2024
 3:07
Life in the Royal Irish Regiment - Army Regiments
▶ 190.0K👍 1.6K💬 0
Army Jobs(85.5K subs)
Sep 3, 2014
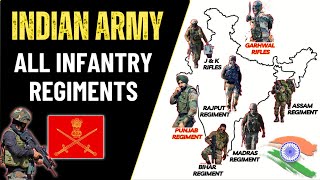 14:19
All Regiments In the Indian Army In Hindi| | Indian Army Regiments
▶ 186.6K👍 5.2K💬 540
Defence Studios(17.8K subs)
Apr 13, 2024
 3:00
[ドイツ軍歌] 行進曲 連隊の挨拶 Regimentsgruß Marsch [ドイツ連邦軍]
▶ 184.4K👍 2.3K💬 128
kiro0821(21.9K subs)
Jun 22, 2019
 6:02
How Cadets Choose Their Regiments | How to join a Regiment in Indian Army
▶ 170.6K👍 4.6K💬 462
Trishul Defence Academy(370.0K subs)
May 29, 2022
 12:35
All 30 Regiments of Renown for DLC Factions! - Total War: Warhammer
▶ 159.5K👍 2.2K💬 152
Zerkovich(298.0K subs)
Aug 7, 2017
 58:53
FIRST LOOK | NEW Cold War RTS is a Promising Combo of World in Conflict & Wargame | Regiments 1.0
▶ 147.7K👍 2.0K💬 120
Raptor(1.2M subs)
Aug 6, 2022
 3:06
Mercian Regiment - Army Regiments - Army Jobs
▶ 139.7K👍 986💬 0
Army Jobs(85.5K subs)
Feb 7, 2014
 5:38
Civil War Unit Organization | Regiments, Brigades, Divisions, Corps, Army | Order of Battle
▶ 133.2K👍 2.8K💬 256
Jeffrey the Librarian(97.2K subs)
Jan 31, 2022
 23:32
The Coolest Imperial Guard Regiments
▶ 128.9K👍 7.4K💬 542
Mr. Bones 40k(193.0K subs)
Jan 24, 2025
Creators also play these games
 $34.99
The Great War: Western Front™
Mixed3.5K reviews
22 shared creators
 $39.99
Sea Power : Naval Combat in the Missile Age
Very Positive7.5K reviews
9 shared creators
 $39.99
Steel Division 2
Mostly Positive10.0K reviews
12 shared creators
 $13.59
WARNO
Very Positive17.3K reviews
22 shared creators
 $29.99
Ultimate General: Civil War
Very Positive8.8K reviews
9 shared creators
 $39.99
War on the Sea
Mostly Positive3.4K reviews
8 shared creators
 $19.99
Steel Division: Normandy 44
Mostly Positive6.5K reviews
10 shared creators
 $59.99
Modern Naval Warfare
Mixed319 reviews
7 shared creators
 $19.99
Wargame: Airland Battle
Very Positive4.6K reviews
5 shared creators
 $19.99
Sudden Strike 4
Mostly Positive8.6K reviews
11 shared creators
Is Regiments Worth It? Player Reviews AnalyzedAI-powered summary, highlights, dimensional insights and SWOT analysis
"The game garners significant appreciation for its enjoyable gameplay that outshines similar titles due to its better pacing and reduced stress, while also boasting outstanding modeling and attention to detail, along with high customizability of controls, yet it faces criticism due to performance issues like low FPS on high-end machines, poorly designed missions that are either too tedious or frustratingly difficult, and a combat system that is viewed as ineffective, along with calls for improved control responsiveness and intuitiveness, which detracts from the overall experience; moreover, while the game offers engaging replayability and is seen as a worthwhile purchase for its price, many players are dissatisfied with a lack of variety in endings and the absence of challenge modes, as well as frustrations regarding DLC that includes core functionalities that arguably should have been part of the base game, reflecting a split opinion on value versus excessive additional costs, and amidst mixed feelings towards multiplayer, where some laud the game as an exemplary RTS while others feel the lack of robust community features diminishes its appeal."
Unlock AI-powered review analysis to discover player sentiment, strengths, weaknesses, multi-dimensional insights and market positioning for this game.
Upgrade to Pro →Regiments Steam Rank HistoryGame ranking by indicators and genres among all Steam games
Unlock ranking data to see how this game performs across all Steam titles by key indicators and genres.
Upgrade to Starter →Games Like RegimentsBased on similar characteristics and audience overlap
Total: 55
1/11
| Name | User Rating | Review Count | Original Price | Gross Revenue | Units Sold | Franchise |
|---|---|---|---|---|---|---|
| 89% | 39.63k | $4.99 | $3.44m | 783.72k | Total War | |
| 66% | 3.45k | $34.99 | $11.13m | 861.02k | -- | |
| 85% | 436.71k | $49.99 | $144.90m | 8.72m | Hearts of Iron | |
| 58% | 43.18k | $59.99 | $182.02m | 4.56m | Company of Heroes | |
| 85% | 10.55k | $19.99 | $3.96m | 469.04k | -- |


What Else Do Regiments Players Also Play?Based on real player follow and wishlist data
By Followers
Total: 10
1/2
| Name | Player Overlap | User Rating | Review Count | Original Price | Gross Revenue | Units Sold | Franchise |
|---|---|---|---|---|---|---|---|
| 24% | 79% | 17.28k | $13.59 | $15.54m | 1.11m | Eugen Systems' Wargame | |
| 15% | 87% | 311.37k | $49.99 | $205.93m | 6.96m | Mount u0026 Blade | |
| 14% | 59% | 185.48k | $49.99 | $1.12b | 24.20m | Starfield | |
| 14% | 82% | 261.66k | $39.99 | $148.43m | 9.03m | -- | |
| 15% | 78% | 373.99k | $24.99 | $499.26m | 17.13m | -- |


* Based on players who follow this game, showing the games they also follow most. Higher player overlap means the two games share a more similar audience.
By Wishlists
Total: 10
1/2
| Name | Player Overlap | User Rating | Review Count | Original Price | Gross Revenue | Units Sold | Franchise |
|---|---|---|---|---|---|---|---|
| 23% | 52% | 44.02k | $49.99 | $78.18m | 6.21m | Broken Arrow | |
| 17% | 84% | 96.27k | $39.99 | $491.96m | 24.58m | -- | |
| 17% | 61% | 7.94k | $44.99 | $38.39m | 1.17m | Fulqrum | |
| 15% | 85% | 26.45k | $24.49 | $17.94m | 1.32m | -- | |
| 12% | 55% | 99.70k | $49.99 | $437.57m | 13.12m | Cities: Skylines |


* Based on players who have wishlisted this game, showing the games they also wishlist most. Higher player overlap means the two games share a more similar audience.